Is Blackline Safety Corp. (TSE:BLN) Trading At A 46% Discount?

Key Insights
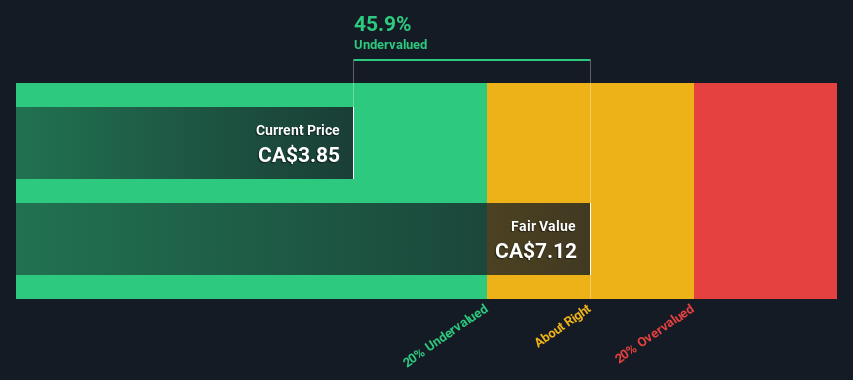
- Using the 2 Stage Free Cash Flow to Equity, Blackline Safety fair value estimate is CA$7.12
- Current share price of CA$3.85 suggests Blackline Safety is potentially 46% undervalued
- Analyst price target for BLN is CA$4.91 which is 31% below our fair value estimate
Today we'll do a simple run through of a valuation method used to estimate the attractiveness of Blackline Safety Corp. (TSE:BLN) as an investment opportunity by taking the forecast future cash flows of the company and discounting them back to today's value. This will be done using the Discounted Cash Flow (DCF) model. Believe it or not, it's not too difficult to follow, as you'll see from our example!
Remember though, that there are many ways to estimate a company's value, and a DCF is just one method. Anyone interested in learning a bit more about intrinsic value should have a read of the Simply Wall St analysis model.
View our latest analysis for Blackline Safety
The Calculation
We use what is known as a 2-stage model, which simply means we have two different periods of growth rates for the company's cash flows. Generally the first stage is higher growth, and the second stage is a lower growth phase. In the first stage we need to estimate the cash flows to the business over the next ten years. Where possible we use analyst estimates, but when these aren't available we extrapolate the previous free cash flow (FCF) from the last estimate or reported value. We assume companies with shrinking free cash flow will slow their rate of shrinkage, and that companies with growing free cash flow will see their growth rate slow, over this period. We do this to reflect that growth tends to slow more in the early years than it does in later years.
A DCF is all about the idea that a dollar in the future is less valuable than a dollar today, so we discount the value of these future cash flows to their estimated value in today's dollars:
10-year free cash flow (FCF) estimate
| 2024 | 2025 | 2026 | 2027 | 2028 | 2029 | 2030 | 2031 | 2032 | 2033 | |
| Levered FCF (CA$, Millions) | -CA$3.24m | CA$750.0k | CA$7.80m | CA$13.6m | CA$18.7m | CA$22.6m | CA$26.1m | CA$29.1m | CA$31.6m | CA$33.6m |
| Growth Rate Estimate Source | Analyst x5 | Analyst x2 | Analyst x2 | Analyst x2 | Analyst x2 | Est @ 21.10% | Est @ 15.35% | Est @ 11.32% | Est @ 8.51% | Est @ 6.53% |
| Present Value (CA$, Millions) Discounted @ 6.5% | -CA$3.0 | CA$0.7 | CA$6.5 | CA$10.5 | CA$13.7 | CA$15.5 | CA$16.8 | CA$17.6 | CA$17.9 | CA$18.0 |
("Est" = FCF growth rate estimated by Simply Wall St)
Present Value of 10-year Cash Flow (PVCF) = CA$114m
The second stage is also known as Terminal Value, this is the business's cash flow after the first stage. For a number of reasons a very conservative growth rate is used that cannot exceed that of a country's GDP growth. In this case we have used the 5-year average of the 10-year government bond yield (1.9%) to estimate future growth. In the same way as with the 10-year 'growth' period, we discount future cash flows to today's value, using a cost of equity of 6.5%.
Terminal Value (TV)= FCF2033 × (1 + g) ÷ (r – g) = CA$34m× (1 + 1.9%) ÷ (6.5%– 1.9%) = CA$755m
Present Value of Terminal Value (PVTV)= TV / (1 + r)10= CA$755m÷ ( 1 + 6.5%)10= CA$403m
The total value is the sum of cash flows for the next ten years plus the discounted terminal value, which results in the Total Equity Value, which in this case is CA$518m. To get the intrinsic value per share, we divide this by the total number of shares outstanding. Relative to the current share price of CA$3.9, the company appears quite undervalued at a 46% discount to where the stock price trades currently. Remember though, that this is just an approximate valuation, and like any complex formula - garbage in, garbage out.
The Assumptions
The calculation above is very dependent on two assumptions. The first is the discount rate and the other is the cash flows. You don't have to agree with these inputs, I recommend redoing the calculations yourself and playing with them. The DCF also does not consider the possible cyclicality of an industry, or a company's future capital requirements, so it does not give a full picture of a company's potential performance. Given that we are looking at Blackline Safety as potential shareholders, the cost of equity is used as the discount rate, rather than the cost of capital (or weighted average cost of capital, WACC) which accounts for debt. In this calculation we've used 6.5%, which is based on a levered beta of 0.908. Beta is a measure of a stock's volatility, compared to the market as a whole. We get our beta from the industry average beta of globally comparable companies, with an imposed limit between 0.8 and 2.0, which is a reasonable range for a stable business.
SWOT Analysis for Blackline Safety
- Debt is well covered by earnings.
- No major weaknesses identified for BLN.
- Trading below our estimate of fair value by more than 20%.
- Debt is not well covered by operating cash flow.
- Has less than 3 years of cash runway based on current free cash flow.
- Not expected to become profitable over the next 3 years.
Next Steps:
Valuation is only one side of the coin in terms of building your investment thesis, and it shouldn't be the only metric you look at when researching a company. DCF models are not the be-all and end-all of investment valuation. Preferably you'd apply different cases and assumptions and see how they would impact the company's valuation. For instance, if the terminal value growth rate is adjusted slightly, it can dramatically alter the overall result. Why is the intrinsic value higher than the current share price? For Blackline Safety, we've compiled three pertinent items you should further examine:
- Risks: Be aware that Blackline Safety is showing 2 warning signs in our investment analysis , and 1 of those is concerning...
- Future Earnings: How does BLN's growth rate compare to its peers and the wider market? Dig deeper into the analyst consensus number for the upcoming years by interacting with our free analyst growth expectation chart.
- Other High Quality Alternatives: Do you like a good all-rounder? Explore our interactive list of high quality stocks to get an idea of what else is out there you may be missing!
PS. Simply Wall St updates its DCF calculation for every Canadian stock every day, so if you want to find the intrinsic value of any other stock just search here.
The New Payments ETF Is Live on NASDAQ:
Money is moving to real-time rails, and a newly listed ETF now gives investors direct exposure. Fast settlement. Institutional custody. Simple access.
Explore how this launch could reshape portfolios
Sponsored ContentValuation is complex, but we're here to simplify it.
Discover if Blackline Safety might be undervalued or overvalued with our detailed analysis, featuring fair value estimates, potential risks, dividends, insider trades, and its financial condition.
Access Free AnalysisHave feedback on this article? Concerned about the content? Get in touch with us directly. Alternatively, email editorial-team (at) simplywallst.com.
This article by Simply Wall St is general in nature. We provide commentary based on historical data and analyst forecasts only using an unbiased methodology and our articles are not intended to be financial advice. It does not constitute a recommendation to buy or sell any stock, and does not take account of your objectives, or your financial situation. We aim to bring you long-term focused analysis driven by fundamental data. Note that our analysis may not factor in the latest price-sensitive company announcements or qualitative material. Simply Wall St has no position in any stocks mentioned.
About TSX:BLN
Blackline Safety
Develops, manufactures, and markets worker safety monitoring products and services in Canada, the United States, Europe, and internationally.
Adequate balance sheet and fair value.
Market Insights

Weekly Picks

THE KINGDOM OF BROWN GOODS: WHY MGPI IS BEING CRUSHED BY INVENTORY & PRIMED FOR RESURRECTION


Why Vertical Aerospace (NYSE: EVTL) is Worth Possibly Over 13x its Current Price


The Quiet Giant That Became AI’s Power Grid
Recently Updated Narratives

Deep Value Multi Bagger Opportunity


A case for CA$31.80 (undiluted), aka 8,616% upside from CA$0.37 (an 86 bagger!).


Unicycive Therapeutics (Nasdaq: UNCY) – Preparing for a Second Shot at Bringing a New Kidney Treatment to Market (TEST)
Popular Narratives


MicroVision will explode future revenue by 380.37% with a vision towards success


NVDA: Expanding AI Demand Will Drive Major Data Center Investments Through 2026


Crazy Undervalued 42 Baggers Silver Play (Active & Running Mine)
Trending Discussion


