Advertisement
Jensen-Group (EBR:JEN) Might Be Having Difficulty Using Its Capital Effectively
If we want to find a potential multi-bagger, often there are underlying trends that can provide clues. Firstly, we'd want to identify a growing return on capital employed (ROCE) and then alongside that, an ever-increasing base of capital employed. Put simply, these types of businesses are compounding machines, meaning they are continually reinvesting their earnings at ever-higher rates of return. Having said that, from a first glance at Jensen-Group (EBR:JEN) we aren't jumping out of our chairs at how returns are trending, but let's have a deeper look.
Understanding Return On Capital Employed (ROCE)
Just to clarify if you're unsure, ROCE is a metric for evaluating how much pre-tax income (in percentage terms) a company earns on the capital invested in its business. The formula for this calculation on Jensen-Group is:
Return on Capital Employed = Earnings Before Interest and Tax (EBIT) ÷ (Total Assets - Current Liabilities)
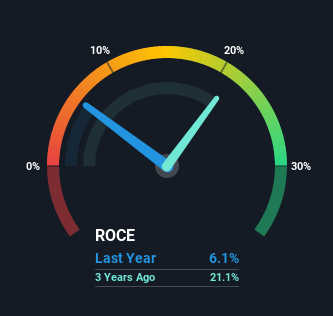
0.061 = €12m ÷ (€278m - €76m) (Based on the trailing twelve months to December 2020).
Therefore, Jensen-Group has an ROCE of 6.1%. Ultimately, that's a low return and it under-performs the Machinery industry average of 8.7%.
See our latest analysis for Jensen-Group
Above you can see how the current ROCE for Jensen-Group compares to its prior returns on capital, but there's only so much you can tell from the past. If you'd like to see what analysts are forecasting going forward, you should check out our free report for Jensen-Group.
What Does the ROCE Trend For Jensen-Group Tell Us?
On the surface, the trend of ROCE at Jensen-Group doesn't inspire confidence. To be more specific, ROCE has fallen from 22% over the last five years. And considering revenue has dropped while employing more capital, we'd be cautious. This could mean that the business is losing its competitive advantage or market share, because while more money is being put into ventures, it's actually producing a lower return - "less bang for their buck" per se.
On a related note, Jensen-Group has decreased its current liabilities to 27% of total assets. That could partly explain why the ROCE has dropped. What's more, this can reduce some aspects of risk to the business because now the company's suppliers or short-term creditors are funding less of its operations. Since the business is basically funding more of its operations with it's own money, you could argue this has made the business less efficient at generating ROCE.
The Bottom Line
From the above analysis, we find it rather worrisome that returns on capital and sales for Jensen-Group have fallen, meanwhile the business is employing more capital than it was five years ago. In spite of that, the stock has delivered a 7.1% return to shareholders who held over the last five years. Either way, we aren't huge fans of the current trends and so with that we think you might find better investments elsewhere.
On a final note, we found 2 warning signs for Jensen-Group (1 makes us a bit uncomfortable) you should be aware of.
For those who like to invest in solid companies, check out this free list of companies with solid balance sheets and high returns on equity.
If you’re looking to trade Jensen-Group, open an account with the lowest-cost* platform trusted by professionals, Interactive Brokers. Their clients from over 200 countries and territories trade stocks, options, futures, forex, bonds and funds worldwide from a single integrated account. Promoted
New: Manage All Your Stock Portfolios in One Place
We've created the ultimate portfolio companion for stock investors, and it's free.
• Connect an unlimited number of Portfolios and see your total in one currency
• Be alerted to new Warning Signs or Risks via email or mobile
• Track the Fair Value of your stocks
This article by Simply Wall St is general in nature. It does not constitute a recommendation to buy or sell any stock, and does not take account of your objectives, or your financial situation. We aim to bring you long-term focused analysis driven by fundamental data. Note that our analysis may not factor in the latest price-sensitive company announcements or qualitative material. Simply Wall St has no position in any stocks mentioned.
*Interactive Brokers Rated Lowest Cost Broker by StockBrokers.com Annual Online Review 2020
Have feedback on this article? Concerned about the content? Get in touch with us directly. Alternatively, email editorial-team (at) simplywallst.com.
About ENXTBR:JEN
Jensen-Group
Designs, produces, and supplies single machines, systems, turnkey solutions, and laundry process automation for the heavy-duty laundry industry.
Flawless balance sheet and undervalued.
Market Insights


Advertisement
Weekly Picks
CE


Ceazar on Conexeu Sciences ·
This small biotech is developing technology that could potentially change how tissue is rebuilt
Fair Value:US$25.3451.9% undervalued
50 followersusers have followed this narrative
0 commentsusers have commented on this narrative
6 likesusers have liked this narrative
HE


HedgeY on Quanta Services ·
The Picks-and-Shovels Leader of the Grid Supercycle
Fair Value:US$7104.2% overvalued
52 followersusers have followed this narrative
0 commentsusers have commented on this narrative
5 likesusers have liked this narrative
FU

FundamentalFlow on Karman Holdings ·
KRMN — Karman Space & Defense: Down 58% from Peak, Is the Market Mispricing a Hypergrowth Defense Compounder?
Fair Value:US$105.654.8% undervalued
34 followersusers have followed this narrative
2 commentsusers have commented on this narrative
16 likesusers have liked this narrative
DO


Double_Bubbler on Invinity Energy Systems ·
Invinity Energy Systems: All About That BESS
Fair Value:UK£161.9% undervalued
40 followersusers have followed this narrative
0 commentsusers have commented on this narrative
6 likesusers have liked this narrative
Recently Updated Narratives
JA


Jacobm2488123 on Netflix ·
Netflix's Revenue Surge Will Hit 18% Despite Market Lows
Fair Value:US$115.9137.1% undervalued
2 followersusers have followed this narrative
0 commentsusers have commented on this narrative
0 likesusers have liked this narrative
LO


Lou_Basenese on Virtuix Holdings ·
From a “Shark Tank” Snub to an Air Force “Yes”: Why Virtuix at $3.50 May Be the Market’sMost Mispriced AI Story
Fair Value:US$7.551.2% undervalued
1 followerusers have followed this narrative
0 commentsusers have commented on this narrative
0 likesusers have liked this narrative
BR

browser on Space Exploration Technologies ·
SpaceX: A Sober Look at Catalysts, Risks, and Long‑Term Value After the IPO
Fair Value:US$0.4633.5k% overvalued
4 followersusers have followed this narrative
0 commentsusers have commented on this narrative
0 likesusers have liked this narrative
Popular Narratives
MA


martinarauz on Nu Holdings ·
Investment Analysis (May 2026)
Fair Value:US$22.7443.8% undervalued
67 followersusers have followed this narrative
0 commentsusers have commented on this narrative
16 likesusers have liked this narrative
HA

HarishPK on Adobe ·
Adobe: A Probabilistic Case for Undervaluation
Fair Value:US$319.9639.1% undervalued
61 followersusers have followed this narrative
9 commentsusers have commented on this narrative
17 likesusers have liked this narrative
HE

HedgeY on AST SpaceMobile ·
AST SpaceMobile: The Boldest Direct-to-Cell Bet in Public Markets
Fair Value:US$17056.9% undervalued
51 followersusers have followed this narrative
0 commentsusers have commented on this narrative
13 likesusers have liked this narrative

