
Advertisement
KBC Group's (EBR:KBC) investors will be pleased with their notable 49% return over the last five years

Stock pickers are generally looking for stocks that will outperform the broader market. And while active stock picking involves risks (and requires diversification) it can also provide excess returns. To wit, the KBC Group share price has climbed 18% in five years, easily topping the market decline of 5.3% (ignoring dividends). On the other hand, the more recent gains haven't been so impressive, with shareholders gaining just 8.4%, including dividends.
So let's assess the underlying fundamentals over the last 5 years and see if they've moved in lock-step with shareholder returns.
Check out our latest analysis for KBC Group
To quote Buffett, 'Ships will sail around the world but the Flat Earth Society will flourish. There will continue to be wide discrepancies between price and value in the marketplace...' One flawed but reasonable way to assess how sentiment around a company has changed is to compare the earnings per share (EPS) with the share price.
Over half a decade, KBC Group managed to grow its earnings per share at 5.3% a year. This EPS growth is higher than the 3% average annual increase in the share price. Therefore, it seems the market has become relatively pessimistic about the company. The reasonably low P/E ratio of 9.33 also suggests market apprehension.
The image below shows how EPS has tracked over time (if you click on the image you can see greater detail).
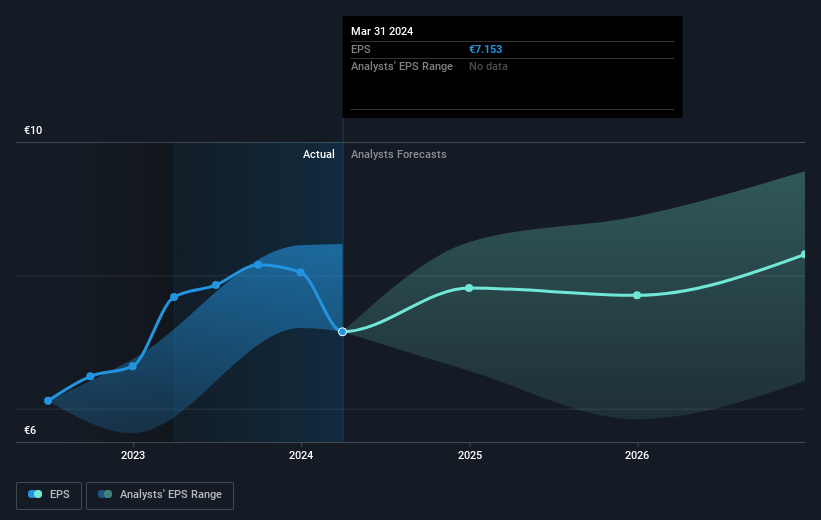
This free interactive report on KBC Group's earnings, revenue and cash flow is a great place to start, if you want to investigate the stock further.
What About Dividends?
As well as measuring the share price return, investors should also consider the total shareholder return (TSR). The TSR incorporates the value of any spin-offs or discounted capital raisings, along with any dividends, based on the assumption that the dividends are reinvested. Arguably, the TSR gives a more comprehensive picture of the return generated by a stock. In the case of KBC Group, it has a TSR of 49% for the last 5 years. That exceeds its share price return that we previously mentioned. This is largely a result of its dividend payments!
A Different Perspective
KBC Group provided a TSR of 8.4% over the last twelve months. But that return falls short of the market. On the bright side, that's still a gain, and it's actually better than the average return of 8% over half a decade It is possible that returns will improve along with the business fundamentals. It's always interesting to track share price performance over the longer term. But to understand KBC Group better, we need to consider many other factors. For instance, we've identified 1 warning sign for KBC Group that you should be aware of.
We will like KBC Group better if we see some big insider buys. While we wait, check out this free list of undervalued stocks (mostly small caps) with considerable, recent, insider buying.
Please note, the market returns quoted in this article reflect the market weighted average returns of stocks that currently trade on Belgian exchanges.
Valuation is complex, but we're here to simplify it.
Discover if KBC Group might be undervalued or overvalued with our detailed analysis, featuring fair value estimates, potential risks, dividends, insider trades, and its financial condition.
Access Free AnalysisHave feedback on this article? Concerned about the content? Get in touch with us directly. Alternatively, email editorial-team (at) simplywallst.com.
This article by Simply Wall St is general in nature. We provide commentary based on historical data and analyst forecasts only using an unbiased methodology and our articles are not intended to be financial advice. It does not constitute a recommendation to buy or sell any stock, and does not take account of your objectives, or your financial situation. We aim to bring you long-term focused analysis driven by fundamental data. Note that our analysis may not factor in the latest price-sensitive company announcements or qualitative material. Simply Wall St has no position in any stocks mentioned.
Have feedback on this article? Concerned about the content? Get in touch with us directly. Alternatively, email editorial-team@simplywallst.com
About ENXTBR:KBC
KBC Group
Provides banking, insurance, and asset management services primarily for retail, private banking, small and medium sized enterprises, and mid-cap clients in Belgium, Bulgaria, the Czech Republic, Hungary, and Slovakia.
Solid track record with adequate balance sheet and pays a dividend.
Similar Companies
Market Insights


Advertisement
Community Narratives
For the Emperor: Why Games Workshop Could Be a Star Investment
Fair Value UK£160.00|0.4% overvalued
RO
Community Contributor
Securitas will boost margins with AI and tech-driven services
Fair Value SEK 260.91|44.5% undervalued
UN
Community Contributor
A Leader in EV Charging with Growth Potential
Fair Value €27.00|17.8% undervalued
TI
Community Contributor