Advertisement
Is Qantas Shares’ Recent Rally Justified After Strong 12 Month Performance?

Simply Wall St
Reviewed by Bailey Pemberton
If you have been eyeing Qantas Airways stock and wondering whether now is the time to buy, hold, or move on, you are not alone. The company has caught plenty of investor attention recently, and for good reason. Qantas closed at $11.19 most recently, and while its price dipped 4.6% over the past month, that comes after a strong year of gains. The stock is still up an impressive 64.3% over the last twelve months, with a long-term five-year return standing at a whopping 179.7%. Even year to date, the company has returned 23.1% for shareholders. That is quite a track record for any airline.
These numbers reflect more than just changing fuel prices or travel trends. Qantas has navigated difficult periods in recent memory, and market sentiment seems to be pricing in not only recovery, but ongoing growth. Interest in aviation stocks globally, as well as broader shifts in travel demand, have lent additional support, leading to renewed confidence from some segments of the market. Short term volatility, as seen in the last month, can partly be explained by investors taking profits or adjusting risk expectations given macroeconomic headlines.
But what about value? By most standard valuation checks, Qantas looks only somewhat undervalued, racking up a value score of 2 out of 6. So, how do these valuation approaches stack up, and what might investors be missing? Let’s break down the methods most analysts use, and then explore a potentially smarter way to judge whether Qantas is a bargain or not.
Qantas Airways scores just 2/6 on our valuation checks. See what other red flags we found in the full valuation breakdown.
Approach 1: Qantas Airways Discounted Cash Flow (DCF) Analysis
The Discounted Cash Flow (DCF) model estimates a company's intrinsic value by projecting its future cash flows and discounting them back to today’s value. This approach helps investors gauge whether the current share price accurately reflects the company's underlying financial health and prospects.
For Qantas Airways, the recent last twelve months' free cash flow stands at A$884 million. Looking forward, analyst forecasts project some variability over the coming decade, with free cash flow hitting A$793 million by financial year 2028. Projections for 2035, which combine analyst opinions and extrapolations, suggest free cash flow could reach around A$651 million. All figures remain under A$1 billion, so they are best understood in millions.
Based on this DCF model, Qantas’s estimated intrinsic value comes out to A$5.82 per share. With the stock recently closing at A$11.19, this implies the shares are trading at a 92.4% premium to their calculated intrinsic value. According to these cash flow projections, the stock appears substantially overvalued.
Result: OVERVALUED
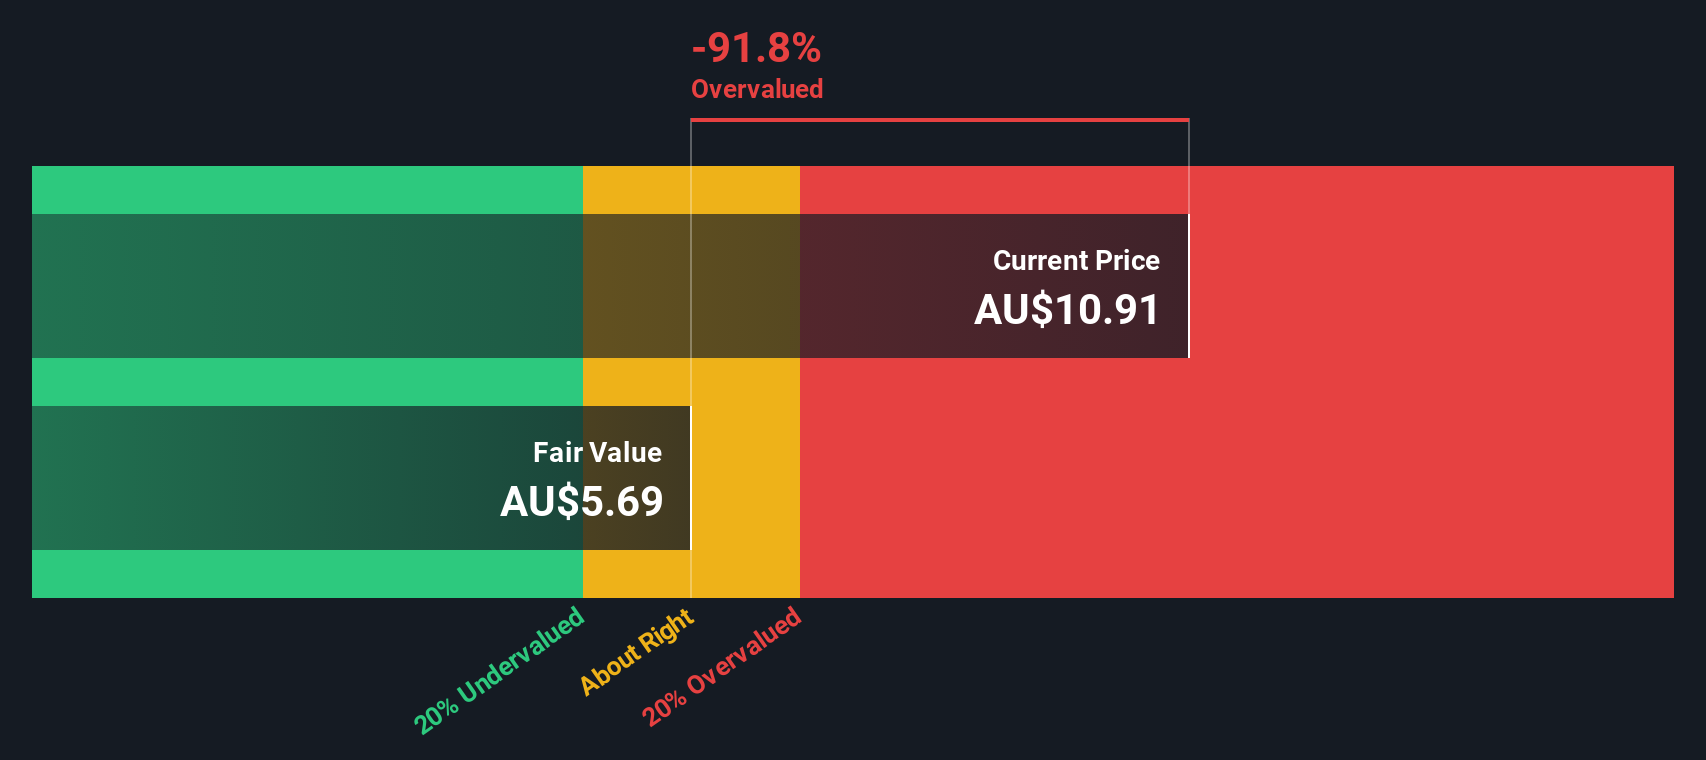
Our Discounted Cash Flow (DCF) analysis suggests Qantas Airways may be overvalued by 92.4%. Find undervalued stocks or create your own screener to find better value opportunities.
Approach 2: Qantas Airways Price vs Earnings (PE)
The Price-to-Earnings (PE) ratio is a widely used metric for valuing profitable companies like Qantas Airways, as it directly ties the share price to how much investors are willing to pay for each dollar of earnings. For businesses generating consistent profit, the PE ratio helps compare their value with others in the sector and provides perspective on expectations for future growth.
Growth prospects and risk play a big role in deciding what counts as a “normal” or “fair” PE ratio. Companies with above-average growth can often command higher PE multiples as investors are willing to pay more today for stronger future results. Likewise, firms with higher risk typically trade at lower multiples, reflecting greater uncertainty around continued profits.
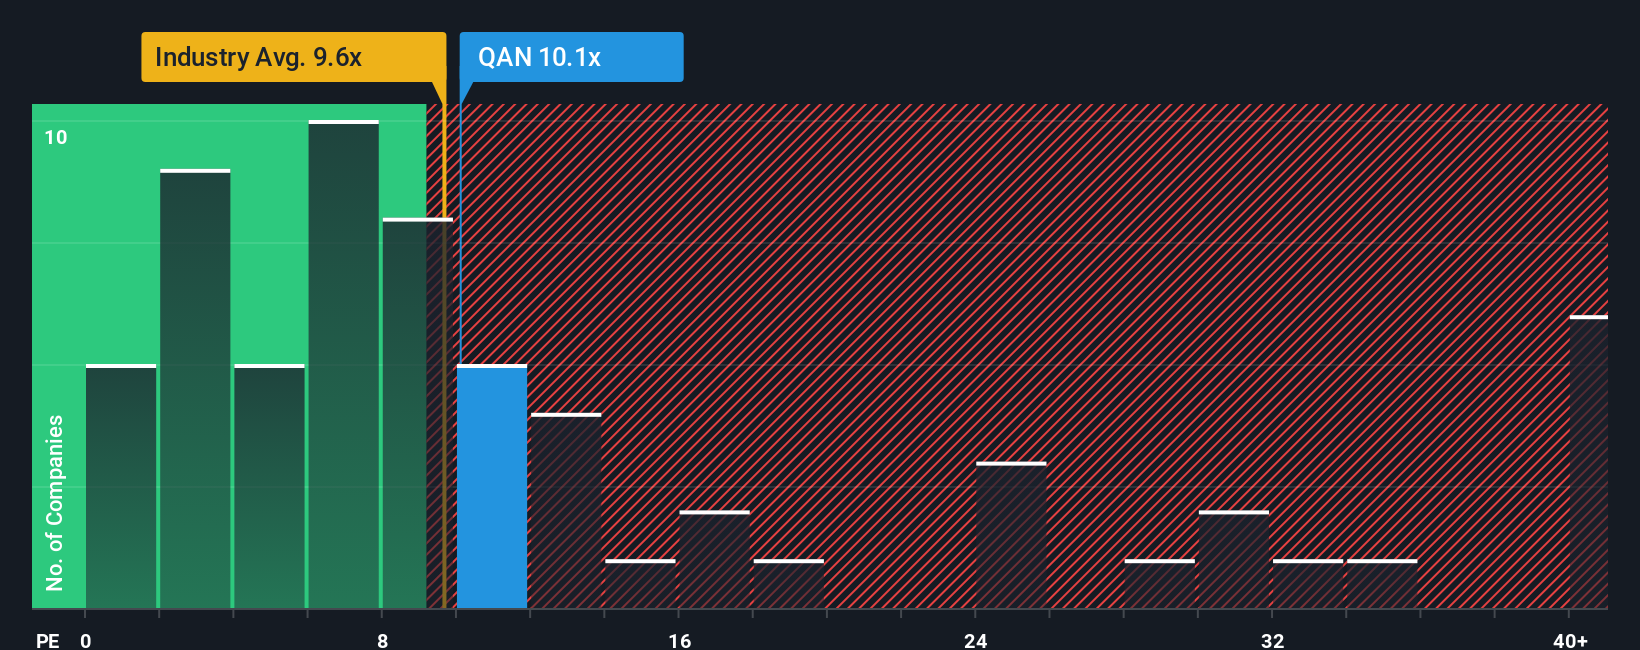
Qantas currently trades at a PE of 10.3x. For context, the average airline industry PE stands at 9.3x, while Qantas’s airline peers average a much higher 25x. At first glance, this puts Qantas below the broader peer group but slightly above the industry norm.
Simply Wall St’s proprietary Fair Ratio provides a tailored benchmark and suggests a “fair” PE multiple of 20.7x for Qantas after factoring in its earnings outlook, profit margins, risk profile, industry and market cap. The Fair Ratio is more rigorous than a simple peer or industry average because it adjusts for what matters most to shareholder returns, such as growth expectations and profitability, not just raw sector numbers.
Comparing Qantas’s actual multiple of 10.3x to its “fair” 20.7x, the shares appear to be trading considerably below what would be expected based on fundamentals and sector context.
Result: UNDERVALUED
PE ratios tell one story, but what if the real opportunity lies elsewhere? Discover companies where insiders are betting big on explosive growth.
Upgrade Your Decision Making: Choose your Qantas Airways Narrative
Earlier we mentioned there is an even better way to understand valuation, so let’s introduce you to Narratives. A Narrative is your personal story and perspective about a company that ties together your views on its business drivers, future revenue, earnings and margins, and what you believe is a fair value for its shares.
Instead of relying only on fixed models or market averages, Narratives let you link Qantas’s story—how you interpret its strategies, brand strength, risks and opportunities—to a financial forecast and a value estimate, all in one place. This approach makes your decision-making both more accurate and more relevant to your own outlook.
On Simply Wall St’s Community page, Narratives are an easy-to-use and accessible tool, already being used by millions of investors worldwide. Narratives help you decide when to buy or sell by showing if your Fair Value lines up with, falls below, or sits above the current market price. They are also dynamic. Whenever new information like news or earnings emerges, your Narrative and fair value update automatically.
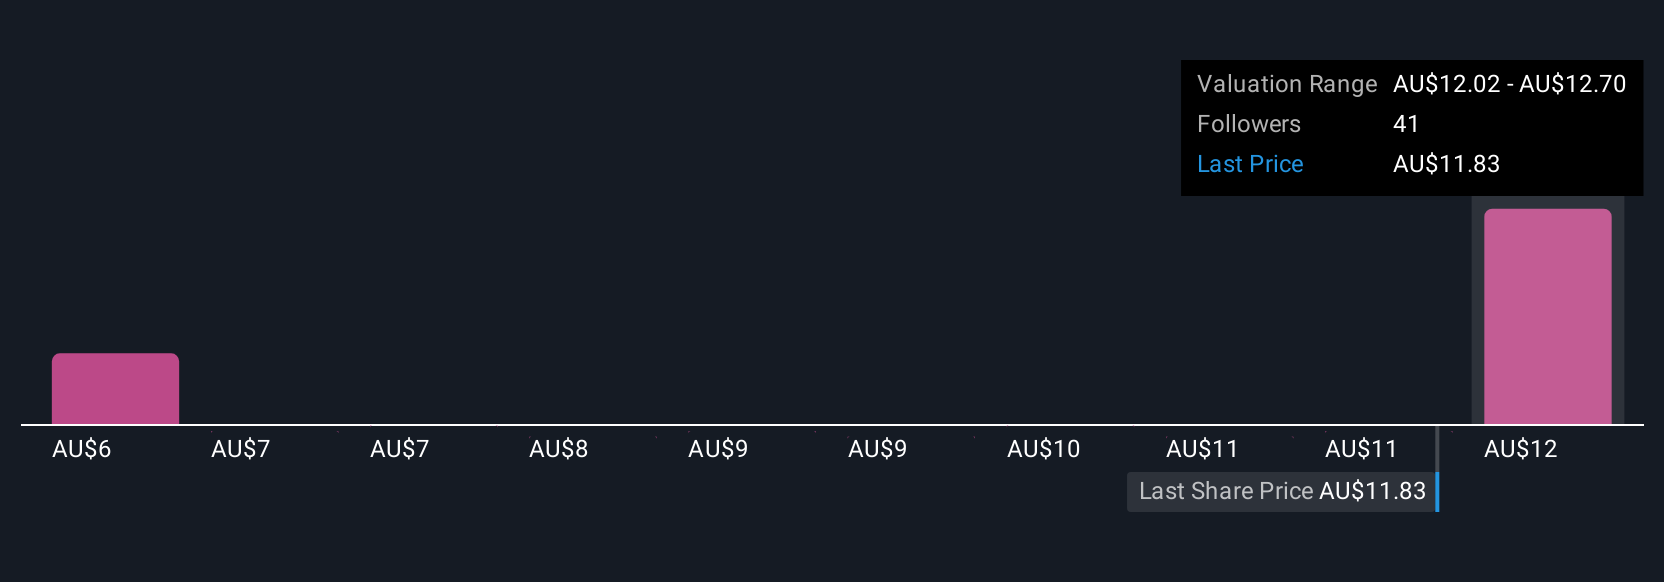
For Qantas Airways, for example, one investor may see strong fleet renewal and loyalty growth driving a fair value of A$14.45, while another might worry about competition and rising costs and set their fair value at just A$9.50. Narratives allow both perspectives to be expressed, tracked, and tested as the facts evolve.
Do you think there's more to the story for Qantas Airways? Create your own Narrative to let the Community know!
This article by Simply Wall St is general in nature. We provide commentary based on historical data and analyst forecasts only using an unbiased methodology and our articles are not intended to be financial advice. It does not constitute a recommendation to buy or sell any stock, and does not take account of your objectives, or your financial situation. We aim to bring you long-term focused analysis driven by fundamental data. Note that our analysis may not factor in the latest price-sensitive company announcements or qualitative material. Simply Wall St has no position in any stocks mentioned.
Valuation is complex, but we're here to simplify it.
Discover if Qantas Airways might be undervalued or overvalued with our detailed analysis, featuring fair value estimates, potential risks, dividends, insider trades, and its financial condition.
Access Free AnalysisHave feedback on this article? Concerned about the content? Get in touch with us directly. Alternatively, email editorial-team@simplywallst.com
About ASX:QAN
Qantas Airways
Provides air transportation services in Australia and internationally.
Slight risk with acceptable track record.
Similar Companies
Market Insights

Advertisement
Community Narratives
A formidable player in AI and enterprise computing.
Fair Value US$210.00|12.2% overvalued
CO
Community Contributor
IREN's Bold Moves in Sustainable Bitcoin Mining & AI Data Centers
Fair Value US$72.52|17.1% undervalued
BL
Community Contributor
Cooling the Champions: The Aussie Tech Behind F1's Victories
Fair Value AU$12.40|38.7% undervalued
TR
Community Contributor