There's Reason For Concern Over Structural Monitoring Systems Plc's (ASX:SMN) Massive 26% Price Jump

Structural Monitoring Systems Plc (ASX:SMN) shares have continued their recent momentum with a 26% gain in the last month alone. The bad news is that even after the stocks recovery in the last 30 days, shareholders are still underwater by about 4.1% over the last year.
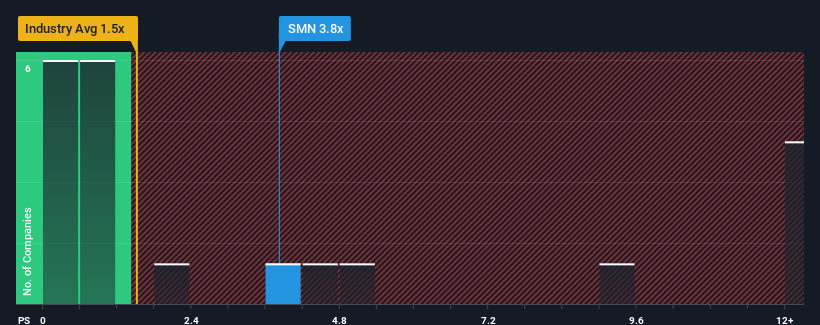
Since its price has surged higher, you could be forgiven for thinking Structural Monitoring Systems is a stock to steer clear of with a price-to-sales ratios (or "P/S") of 3.8x, considering almost half the companies in Australia's Electronic industry have P/S ratios below 1.1x. Nonetheless, we'd need to dig a little deeper to determine if there is a rational basis for the highly elevated P/S.
View our latest analysis for Structural Monitoring Systems
What Does Structural Monitoring Systems' Recent Performance Look Like?
With revenue growth that's exceedingly strong of late, Structural Monitoring Systems has been doing very well. The P/S ratio is probably high because investors think this strong revenue growth will be enough to outperform the broader industry in the near future. If not, then existing shareholders might be a little nervous about the viability of the share price.
Want the full picture on earnings, revenue and cash flow for the company? Then our free report on Structural Monitoring Systems will help you shine a light on its historical performance.Is There Enough Revenue Growth Forecasted For Structural Monitoring Systems?
Structural Monitoring Systems' P/S ratio would be typical for a company that's expected to deliver very strong growth, and importantly, perform much better than the industry.
If we review the last year of revenue growth, the company posted a terrific increase of 34%. The latest three year period has also seen an excellent 36% overall rise in revenue, aided by its short-term performance. Therefore, it's fair to say the revenue growth recently has been superb for the company.
Comparing that to the industry, which is predicted to deliver 19% growth in the next 12 months, the company's momentum is weaker, based on recent medium-term annualised revenue results.
In light of this, it's alarming that Structural Monitoring Systems' P/S sits above the majority of other companies. It seems most investors are ignoring the fairly limited recent growth rates and are hoping for a turnaround in the company's business prospects. There's a good chance existing shareholders are setting themselves up for future disappointment if the P/S falls to levels more in line with recent growth rates.
The Bottom Line On Structural Monitoring Systems' P/S
Shares in Structural Monitoring Systems have seen a strong upwards swing lately, which has really helped boost its P/S figure. Typically, we'd caution against reading too much into price-to-sales ratios when settling on investment decisions, though it can reveal plenty about what other market participants think about the company.
The fact that Structural Monitoring Systems currently trades on a higher P/S relative to the industry is an oddity, since its recent three-year growth is lower than the wider industry forecast. When we observe slower-than-industry revenue growth alongside a high P/S ratio, we assume there to be a significant risk of the share price decreasing, which would result in a lower P/S ratio. Unless the recent medium-term conditions improve markedly, it's very challenging to accept these the share price as being reasonable.
And what about other risks? Every company has them, and we've spotted 2 warning signs for Structural Monitoring Systems you should know about.
If strong companies turning a profit tickle your fancy, then you'll want to check out this free list of interesting companies that trade on a low P/E (but have proven they can grow earnings).
Mobile Infrastructure for Defense and Disaster
The next wave in robotics isn't humanoid. Its fully autonomous towers delivering 5G, ISR, and radar in under 30 minutes, anywhere.
Get the investor briefing before the next round of contracts
Sponsored On Behalf of CiTechNew: Manage All Your Stock Portfolios in One Place
We've created the ultimate portfolio companion for stock investors, and it's free.
• Connect an unlimited number of Portfolios and see your total in one currency
• Be alerted to new Warning Signs or Risks via email or mobile
• Track the Fair Value of your stocks
Have feedback on this article? Concerned about the content? Get in touch with us directly. Alternatively, email editorial-team (at) simplywallst.com.
This article by Simply Wall St is general in nature. We provide commentary based on historical data and analyst forecasts only using an unbiased methodology and our articles are not intended to be financial advice. It does not constitute a recommendation to buy or sell any stock, and does not take account of your objectives, or your financial situation. We aim to bring you long-term focused analysis driven by fundamental data. Note that our analysis may not factor in the latest price-sensitive company announcements or qualitative material. Simply Wall St has no position in any stocks mentioned.
About ASX:SMN
Structural Monitoring Systems
Engages in the design, development, and manufacture of avionic products in the Americas, Europe, the United Kingdom, Asia, Middle East, Australasia, and Africa.
Excellent balance sheet with questionable track record.
Market Insights

Weekly Picks

THE KINGDOM OF BROWN GOODS: WHY MGPI IS BEING CRUSHED BY INVENTORY & PRIMED FOR RESURRECTION


Why Vertical Aerospace (NYSE: EVTL) is Worth Possibly Over 13x its Current Price


The Quiet Giant That Became AI’s Power Grid
Recently Updated Narratives


MINISO's fair value is projected at 26.69 with an anticipated PE ratio shift of 20x

Fiverr International will transform the freelance industry with AI-powered growth

Stride Stock: Online Education Finds Its Second Act
Popular Narratives


MicroVision will explode future revenue by 380.37% with a vision towards success


Crazy Undervalued 42 Baggers Silver Play (Active & Running Mine)


