
Advertisement
Cape Range Full Year 2023 Earnings: AU$0.006 loss per share (vs AU$0.007 loss in FY 2022)

Cape Range (ASX:CAG) Full Year 2023 Results
Key Financial Results
- Revenue: AU$601.9k (up 14% from FY 2022).
- Net loss: AU$563.9k (loss narrowed by 14% from FY 2022).
- AU$0.006 loss per share (improved from AU$0.007 loss in FY 2022).
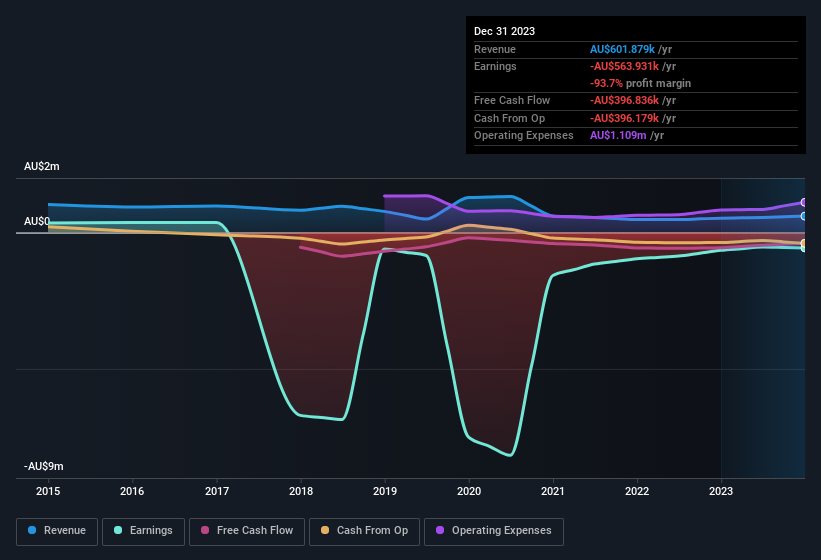
All figures shown in the chart above are for the trailing 12 month (TTM) period
Cape Range's share price is broadly unchanged from a week ago.
Risk Analysis
Don't forget that there may still be risks. For instance, we've identified 3 warning signs for Cape Range that you should be aware of.
New: AI Stock Screener & Alerts
Our new AI Stock Screener scans the market every day to uncover opportunities.
• Dividend Powerhouses (3%+ Yield)
• Undervalued Small Caps with Insider Buying
• High growth Tech and AI Companies
Or build your own from over 50 metrics.
Have feedback on this article? Concerned about the content? Get in touch with us directly. Alternatively, email editorial-team (at) simplywallst.com.
This article by Simply Wall St is general in nature. We provide commentary based on historical data and analyst forecasts only using an unbiased methodology and our articles are not intended to be financial advice. It does not constitute a recommendation to buy or sell any stock, and does not take account of your objectives, or your financial situation. We aim to bring you long-term focused analysis driven by fundamental data. Note that our analysis may not factor in the latest price-sensitive company announcements or qualitative material. Simply Wall St has no position in any stocks mentioned.
About ASX:CAG
Cape Range
Develops and distributes enterprise management software in Malaysia.
Flawless balance sheet low.
Market Insights

Advertisement
Community Narratives
Scaling up in building materials with smart M&A and growing profitability
Fair Value US$2.77|29.6% undervalued
CM
Community Contributor
Hims: The Platform Powering Personalised Healthcare
Fair Value US$114.01|49.1% undervalued
BL
Community Contributor
Undervalued lottery company with strong fundamentals
Fair Value AU$15.00|35.4% undervalued
RO
Community Contributor
Proximus, transferring money from the impatient to the patient investor
Fair Value €16.62|54.5% undervalued
AX
Community Contributor