- Australia
- /
- Construction
- /
- ASX:SHA
ASX Dividend Stocks MyState And 2 Others For Your Portfolio

Reviewed by Simply Wall St
As the ASX200 closed down 0.83% at 8,180 points amidst falling inflation and cautious investor sentiment, Australia's market landscape presents both challenges and opportunities for investors. In such an environment, dividend stocks can offer a measure of stability and income potential, making them an attractive option for those looking to navigate the current economic conditions.
Top 10 Dividend Stocks In Australia
| Name | Dividend Yield | Dividend Rating |
| Perenti (ASX:PRN) | 6.84% | ★★★★★☆ |
| Nick Scali (ASX:NCK) | 4.69% | ★★★★★☆ |
| Super Retail Group (ASX:SUL) | 8.24% | ★★★★★☆ |
| Collins Foods (ASX:CKF) | 3.36% | ★★★★★☆ |
| MFF Capital Investments (ASX:MFF) | 3.55% | ★★★★★☆ |
| Fiducian Group (ASX:FID) | 4.23% | ★★★★★☆ |
| National Storage REIT (ASX:NSR) | 4.40% | ★★★★★☆ |
| Premier Investments (ASX:PMV) | 4.21% | ★★★★★☆ |
| New Hope (ASX:NHC) | 7.99% | ★★★★☆☆ |
| Sugar Terminals (NSX:SUG) | 7.45% | ★★★★☆☆ |
Click here to see the full list of 38 stocks from our Top ASX Dividend Stocks screener.
Let's uncover some gems from our specialized screener.
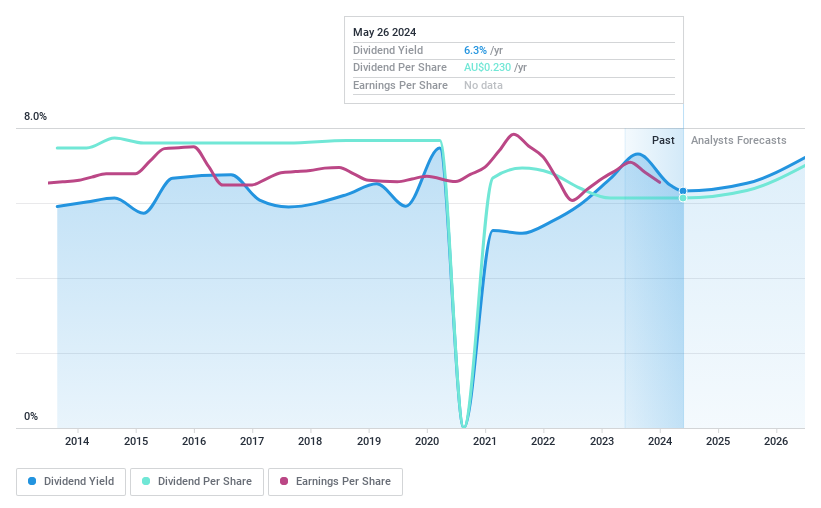
MyState (ASX:MYS)
Simply Wall St Dividend Rating: ★★★★☆☆
Overview: MyState Limited operates in Australia offering banking, trustee, and managed fund products and services, with a market cap of A$420.47 million.
Operations: MyState Limited generates its revenue primarily from its Banking segment, which accounts for A$135.47 million, and its Wealth Management segment, contributing A$15.68 million.
Dividend Yield: 6.1%
MyState's dividend yield ranks in the top 25% of Australian dividend payers, supported by a reasonable payout ratio of 71.8%. However, its dividends have been unreliable over the past decade with volatility and declines. Recent earnings showed a drop to A$35.29 million from A$38.5 million last year, which could impact future payouts. The company's P/E ratio is favorable at 11.9x compared to the market average of 19.7x, indicating potential value for investors despite dividend instability concerns.
- Click here to discover the nuances of MyState with our detailed analytical dividend report.
- Upon reviewing our latest valuation report, MyState's share price might be too optimistic.
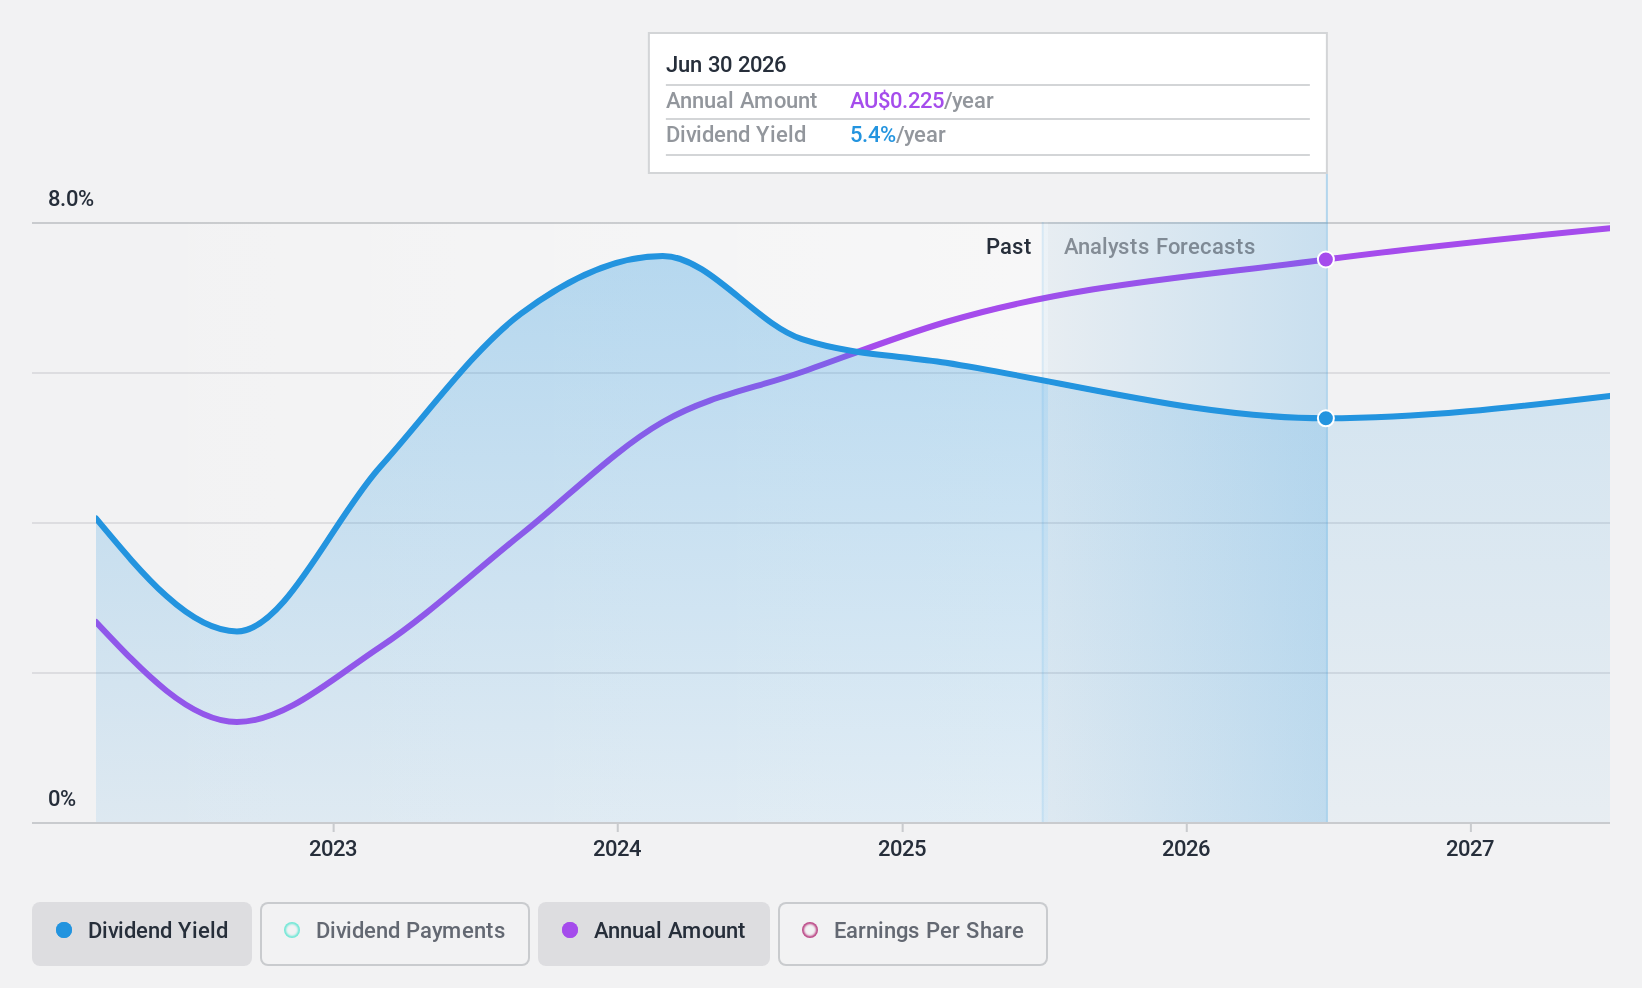
SHAPE Australia (ASX:SHA)
Simply Wall St Dividend Rating: ★★★★☆☆
Overview: SHAPE Australia Corporation Limited operates in the construction, fitout, and refurbishment of commercial properties within Australia and has a market cap of approximately A$227.18 million.
Operations: SHAPE Australia's revenue primarily comes from its Heavy Construction segment, amounting to A$839 million.
Dividend Yield: 6.6%
SHAPE Australia's dividend yield is among the top 25% in Australia, with a payout ratio of 88.3%, indicating earnings coverage. Despite recent dividend increases, its three-year track record shows volatility and unreliability. Earnings rose significantly to A$16.01 million from A$10.5 million last year, supporting payouts alongside a cash payout ratio of 53.2%. Trading at a discount to estimated fair value suggests potential investment appeal despite an unstable dividend history.
- Unlock comprehensive insights into our analysis of SHAPE Australia stock in this dividend report.
- Our comprehensive valuation report raises the possibility that SHAPE Australia is priced lower than what may be justified by its financials.
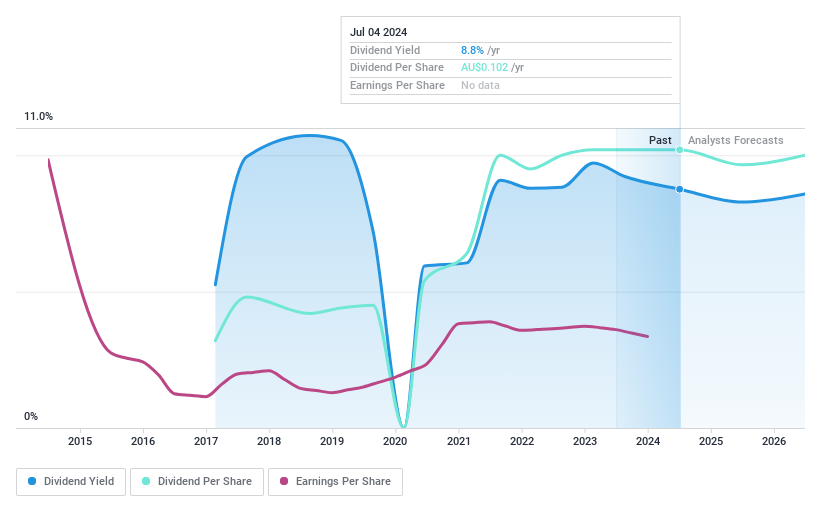
Shaver Shop Group (ASX:SSG)
Simply Wall St Dividend Rating: ★★★★☆☆
Overview: Shaver Shop Group Limited is a retailer of personal care and grooming products operating in Australia and New Zealand, with a market cap of A$181.45 million.
Operations: Shaver Shop Group Limited generates revenue primarily through retail store sales of specialist personal grooming products, amounting to A$219.37 million.
Dividend Yield: 7.4%
Shaver Shop Group's dividend yield ranks in the top 25% of Australian payers, with a payout ratio of 87%, indicating coverage by earnings. Despite an increase in dividends over eight years, payments have been volatile and unreliable. The recent declaration of a fully franked 5.5 cent per share dividend aligns with last year's payout, supported by a cash payout ratio of 48.1%. Trading below estimated fair value enhances its appeal despite an unstable dividend history.
- Click to explore a detailed breakdown of our findings in Shaver Shop Group's dividend report.
- The analysis detailed in our Shaver Shop Group valuation report hints at an deflated share price compared to its estimated value.
Key Takeaways
- Take a closer look at our Top ASX Dividend Stocks list of 38 companies by clicking here.
- Have a stake in these businesses? Integrate your holdings into Simply Wall St's portfolio for notifications and detailed stock reports.
- Streamline your investment strategy with Simply Wall St's app for free and benefit from extensive research on stocks across all corners of the world.
Want To Explore Some Alternatives?
- Explore high-performing small cap companies that haven't yet garnered significant analyst attention.
- Fuel your portfolio with companies showing strong growth potential, backed by optimistic outlooks both from analysts and management.
- Find companies with promising cash flow potential yet trading below their fair value.
This article by Simply Wall St is general in nature. We provide commentary based on historical data and analyst forecasts only using an unbiased methodology and our articles are not intended to be financial advice. It does not constitute a recommendation to buy or sell any stock, and does not take account of your objectives, or your financial situation. We aim to bring you long-term focused analysis driven by fundamental data. Note that our analysis may not factor in the latest price-sensitive company announcements or qualitative material. Simply Wall St has no position in any stocks mentioned.
If you're looking to trade SHAPE Australia, open an account with the lowest-cost platform trusted by professionals, Interactive Brokers.
With clients in over 200 countries and territories, and access to 160 markets, IBKR lets you trade stocks, options, futures, forex, bonds and funds from a single integrated account.
Enjoy no hidden fees, no account minimums, and FX conversion rates as low as 0.03%, far better than what most brokers offer.
Sponsored ContentNew: Manage All Your Stock Portfolios in One Place
We've created the ultimate portfolio companion for stock investors, and it's free.
• Connect an unlimited number of Portfolios and see your total in one currency
• Be alerted to new Warning Signs or Risks via email or mobile
• Track the Fair Value of your stocks
Have feedback on this article? Concerned about the content? Get in touch with us directly. Alternatively, email editorial-team@simplywallst.com
About ASX:SHA
SHAPE Australia
Engages in the construction, fitout, and refurbishment of commercial properties in Australia.
Outstanding track record with flawless balance sheet and pays a dividend.
