- Australia
- /
- Specialty Stores
- /
- ASX:APE
Eagers Automotive's (ASX:APE) five-year total shareholder returns outpace the underlying earnings growth


Eagers Automotive Limited (ASX:APE) shareholders might be concerned after seeing the share price drop 15% in the last month. But the silver lining is the stock is up over five years. Unfortunately its return of 36% is below the market return of 54%.
Although Eagers Automotive has shed AU$153m from its market cap this week, let's take a look at its longer term fundamental trends and see if they've driven returns.
View our latest analysis for Eagers Automotive
To paraphrase Benjamin Graham: Over the short term the market is a voting machine, but over the long term it's a weighing machine. One flawed but reasonable way to assess how sentiment around a company has changed is to compare the earnings per share (EPS) with the share price.
Over half a decade, Eagers Automotive managed to grow its earnings per share at 17% a year. The EPS growth is more impressive than the yearly share price gain of 6% over the same period. So it seems the market isn't so enthusiastic about the stock these days. The reasonably low P/E ratio of 11.12 also suggests market apprehension.
The graphic below depicts how EPS has changed over time (unveil the exact values by clicking on the image).
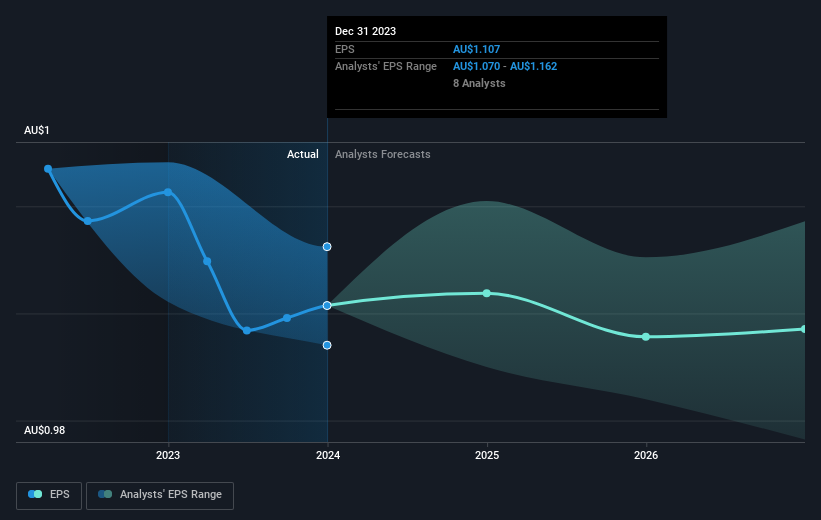
We consider it positive that insiders have made significant purchases in the last year. Even so, future earnings will be far more important to whether current shareholders make money. Before buying or selling a stock, we always recommend a close examination of historic growth trends, available here..
What About Dividends?
When looking at investment returns, it is important to consider the difference between total shareholder return (TSR) and share price return. Whereas the share price return only reflects the change in the share price, the TSR includes the value of dividends (assuming they were reinvested) and the benefit of any discounted capital raising or spin-off. Arguably, the TSR gives a more comprehensive picture of the return generated by a stock. We note that for Eagers Automotive the TSR over the last 5 years was 69%, which is better than the share price return mentioned above. The dividends paid by the company have thusly boosted the total shareholder return.
A Different Perspective
While the broader market gained around 11% in the last year, Eagers Automotive shareholders lost 7.7% (even including dividends). Even the share prices of good stocks drop sometimes, but we want to see improvements in the fundamental metrics of a business, before getting too interested. Longer term investors wouldn't be so upset, since they would have made 11%, each year, over five years. If the fundamental data continues to indicate long term sustainable growth, the current sell-off could be an opportunity worth considering. I find it very interesting to look at share price over the long term as a proxy for business performance. But to truly gain insight, we need to consider other information, too. To that end, you should learn about the 4 warning signs we've spotted with Eagers Automotive (including 1 which makes us a bit uncomfortable) .
There are plenty of other companies that have insiders buying up shares. You probably do not want to miss this free list of growing companies that insiders are buying.
Please note, the market returns quoted in this article reflect the market weighted average returns of stocks that currently trade on Australian exchanges.
Valuation is complex, but we're here to simplify it.
Discover if Eagers Automotive might be undervalued or overvalued with our detailed analysis, featuring fair value estimates, potential risks, dividends, insider trades, and its financial condition.
Access Free AnalysisHave feedback on this article? Concerned about the content? Get in touch with us directly. Alternatively, email editorial-team (at) simplywallst.com.
This article by Simply Wall St is general in nature. We provide commentary based on historical data and analyst forecasts only using an unbiased methodology and our articles are not intended to be financial advice. It does not constitute a recommendation to buy or sell any stock, and does not take account of your objectives, or your financial situation. We aim to bring you long-term focused analysis driven by fundamental data. Note that our analysis may not factor in the latest price-sensitive company announcements or qualitative material. Simply Wall St has no position in any stocks mentioned.
About ASX:APE
Eagers Automotive
An automotive retail company, owns and operates motor vehicle dealerships in Australia and New Zealand.
Established dividend payer and good value.

