REA Group's (ASX:REA) Returns On Capital Not Reflecting Well On The Business


To find a multi-bagger stock, what are the underlying trends we should look for in a business? Typically, we'll want to notice a trend of growing return on capital employed (ROCE) and alongside that, an expanding base of capital employed. If you see this, it typically means it's a company with a great business model and plenty of profitable reinvestment opportunities. Looking at REA Group (ASX:REA), it does have a high ROCE right now, but lets see how returns are trending.
Return On Capital Employed (ROCE): What Is It?
Just to clarify if you're unsure, ROCE is a metric for evaluating how much pre-tax income (in percentage terms) a company earns on the capital invested in its business. The formula for this calculation on REA Group is:
Return on Capital Employed = Earnings Before Interest and Tax (EBIT) ÷ (Total Assets - Current Liabilities)
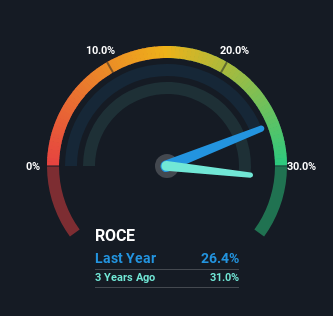
0.26 = AU$622m ÷ (AU$2.7b - AU$321m) (Based on the trailing twelve months to December 2023).
Thus, REA Group has an ROCE of 26%. That's a fantastic return and not only that, it outpaces the average of 8.0% earned by companies in a similar industry.
View our latest analysis for REA Group
Above you can see how the current ROCE for REA Group compares to its prior returns on capital, but there's only so much you can tell from the past. If you're interested, you can view the analysts predictions in our free analyst report for REA Group .
How Are Returns Trending?
When we looked at the ROCE trend at REA Group, we didn't gain much confidence. To be more specific, while the ROCE is still high, it's fallen from 41% where it was five years ago. Meanwhile, the business is utilizing more capital but this hasn't moved the needle much in terms of sales in the past 12 months, so this could reflect longer term investments. It's worth keeping an eye on the company's earnings from here on to see if these investments do end up contributing to the bottom line.
On a side note, REA Group has done well to pay down its current liabilities to 12% of total assets. That could partly explain why the ROCE has dropped. Effectively this means their suppliers or short-term creditors are funding less of the business, which reduces some elements of risk. Since the business is basically funding more of its operations with it's own money, you could argue this has made the business less efficient at generating ROCE.
In Conclusion...
Bringing it all together, while we're somewhat encouraged by REA Group's reinvestment in its own business, we're aware that returns are shrinking. Investors must think there's better things to come because the stock has knocked it out of the park, delivering a 114% gain to shareholders who have held over the last five years. But if the trajectory of these underlying trends continue, we think the likelihood of it being a multi-bagger from here isn't high.
One more thing, we've spotted 1 warning sign facing REA Group that you might find interesting.
High returns are a key ingredient to strong performance, so check out our free list ofstocks earning high returns on equity with solid balance sheets.
New: AI Stock Screener & Alerts
Our new AI Stock Screener scans the market every day to uncover opportunities.
• Dividend Powerhouses (3%+ Yield)
• Undervalued Small Caps with Insider Buying
• High growth Tech and AI Companies
Or build your own from over 50 metrics.
Have feedback on this article? Concerned about the content? Get in touch with us directly. Alternatively, email editorial-team (at) simplywallst.com.
This article by Simply Wall St is general in nature. We provide commentary based on historical data and analyst forecasts only using an unbiased methodology and our articles are not intended to be financial advice. It does not constitute a recommendation to buy or sell any stock, and does not take account of your objectives, or your financial situation. We aim to bring you long-term focused analysis driven by fundamental data. Note that our analysis may not factor in the latest price-sensitive company announcements or qualitative material. Simply Wall St has no position in any stocks mentioned.
About ASX:REA
REA Group
Engages in online property advertising business in Australia, India, the United States, Malaysia, Singapore, Thailand, Vietnam, and internationally.
Outstanding track record with flawless balance sheet.
Similar Companies
Market Insights

Community Narratives

