REA Group (ASX:REA) Could Easily Take On More Debt


Howard Marks put it nicely when he said that, rather than worrying about share price volatility, 'The possibility of permanent loss is the risk I worry about... and every practical investor I know worries about.' So it might be obvious that you need to consider debt, when you think about how risky any given stock is, because too much debt can sink a company. Importantly, REA Group Limited (ASX:REA) does carry debt. But is this debt a concern to shareholders?
When Is Debt Dangerous?
Debt is a tool to help businesses grow, but if a business is incapable of paying off its lenders, then it exists at their mercy. If things get really bad, the lenders can take control of the business. However, a more common (but still painful) scenario is that it has to raise new equity capital at a low price, thus permanently diluting shareholders. Of course, plenty of companies use debt to fund growth, without any negative consequences. When we think about a company's use of debt, we first look at cash and debt together.
Check out our latest analysis for REA Group
How Much Debt Does REA Group Carry?
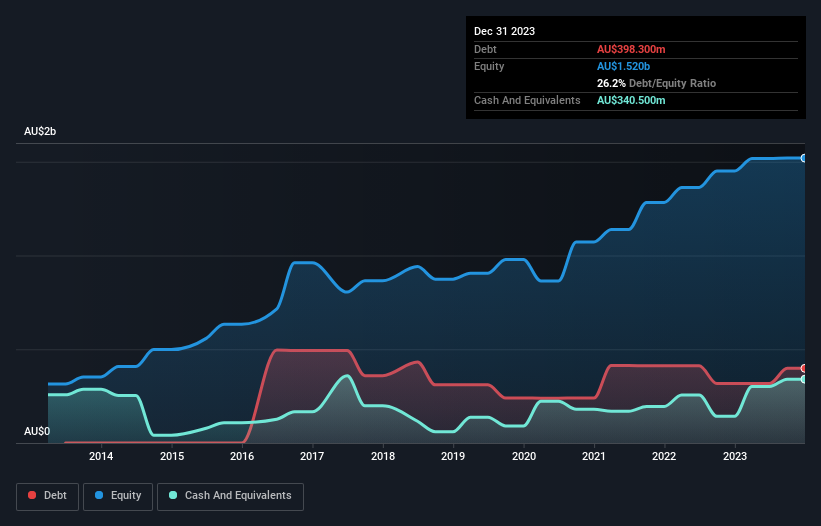
The image below, which you can click on for greater detail, shows that at December 2023 REA Group had debt of AU$398.3m, up from AU$316.7m in one year. On the flip side, it has AU$340.5m in cash leading to net debt of about AU$57.8m.
How Strong Is REA Group's Balance Sheet?
We can see from the most recent balance sheet that REA Group had liabilities of AU$321.1m falling due within a year, and liabilities of AU$837.8m due beyond that. On the other hand, it had cash of AU$340.5m and AU$392.5m worth of receivables due within a year. So its liabilities outweigh the sum of its cash and (near-term) receivables by AU$425.9m.
This state of affairs indicates that REA Group's balance sheet looks quite solid, as its total liabilities are just about equal to its liquid assets. So it's very unlikely that the AU$24.7b company is short on cash, but still worth keeping an eye on the balance sheet. But either way, REA Group has virtually no net debt, so it's fair to say it does not have a heavy debt load!
We use two main ratios to inform us about debt levels relative to earnings. The first is net debt divided by earnings before interest, tax, depreciation, and amortization (EBITDA), while the second is how many times its earnings before interest and tax (EBIT) covers its interest expense (or its interest cover, for short). This way, we consider both the absolute quantum of the debt, as well as the interest rates paid on it.
REA Group has very little debt (net of cash), and boasts a debt to EBITDA ratio of 0.09 and EBIT of 44.1 times the interest expense. So relative to past earnings, the debt load seems trivial. And we also note warmly that REA Group grew its EBIT by 13% last year, making its debt load easier to handle. The balance sheet is clearly the area to focus on when you are analysing debt. But ultimately the future profitability of the business will decide if REA Group can strengthen its balance sheet over time. So if you're focused on the future you can check out this free report showing analyst profit forecasts.
Finally, a business needs free cash flow to pay off debt; accounting profits just don't cut it. So we clearly need to look at whether that EBIT is leading to corresponding free cash flow. During the last three years, REA Group produced sturdy free cash flow equating to 66% of its EBIT, about what we'd expect. This free cash flow puts the company in a good position to pay down debt, when appropriate.
Our View
REA Group's interest cover suggests it can handle its debt as easily as Cristiano Ronaldo could score a goal against an under 14's goalkeeper. And the good news does not stop there, as its net debt to EBITDA also supports that impression! Zooming out, REA Group seems to use debt quite reasonably; and that gets the nod from us. After all, sensible leverage can boost returns on equity. There's no doubt that we learn most about debt from the balance sheet. But ultimately, every company can contain risks that exist outside of the balance sheet. We've identified 1 warning sign with REA Group , and understanding them should be part of your investment process.
If you're interested in investing in businesses that can grow profits without the burden of debt, then check out this free list of growing businesses that have net cash on the balance sheet.
New: AI Stock Screener & Alerts
Our new AI Stock Screener scans the market every day to uncover opportunities.
• Dividend Powerhouses (3%+ Yield)
• Undervalued Small Caps with Insider Buying
• High growth Tech and AI Companies
Or build your own from over 50 metrics.
Have feedback on this article? Concerned about the content? Get in touch with us directly. Alternatively, email editorial-team (at) simplywallst.com.
This article by Simply Wall St is general in nature. We provide commentary based on historical data and analyst forecasts only using an unbiased methodology and our articles are not intended to be financial advice. It does not constitute a recommendation to buy or sell any stock, and does not take account of your objectives, or your financial situation. We aim to bring you long-term focused analysis driven by fundamental data. Note that our analysis may not factor in the latest price-sensitive company announcements or qualitative material. Simply Wall St has no position in any stocks mentioned.
About ASX:REA
REA Group
Engages in online property advertising business in Australia, India, the United States, Malaysia, Singapore, Thailand, Vietnam, and internationally.
Outstanding track record with flawless balance sheet.
Similar Companies
Market Insights

Community Narratives

