Advertisement
- Australia
- /
- Metals and Mining
- /
- ASX:TYX
Pancontinental Energy And 2 Other ASX Penny Stocks To Consider

Simply Wall St
Reviewed by Simply Wall St
The Australian market is currently navigating a complex landscape marked by high local inflation, an RBA pause, record gold prices, and geopolitical tensions impacting commodities. In such a climate, investors often turn their attention to smaller companies that might offer unique opportunities. Penny stocks, though an older term, still represent these smaller or less-established entities that can provide value when backed by strong financials and growth potential.
Top 10 Penny Stocks In Australia
| Name | Share Price | Market Cap | Rewards & Risks |
| Alfabs Australia (ASX:AAL) | A$0.50 | A$143.29M | ✅ 4 ⚠️ 3 View Analysis > |
| EZZ Life Science Holdings (ASX:EZZ) | A$2.39 | A$112.74M | ✅ 2 ⚠️ 2 View Analysis > |
| Dusk Group (ASX:DSK) | A$0.805 | A$50.13M | ✅ 4 ⚠️ 2 View Analysis > |
| IVE Group (ASX:IGL) | A$2.80 | A$431.86M | ✅ 4 ⚠️ 3 View Analysis > |
| MotorCycle Holdings (ASX:MTO) | A$3.18 | A$234.7M | ✅ 4 ⚠️ 2 View Analysis > |
| Pureprofile (ASX:PPL) | A$0.042 | A$49.13M | ✅ 3 ⚠️ 1 View Analysis > |
| Veris (ASX:VRS) | A$0.074 | A$38.31M | ✅ 4 ⚠️ 2 View Analysis > |
| West African Resources (ASX:WAF) | A$3.04 | A$3.47B | ✅ 4 ⚠️ 1 View Analysis > |
| Praemium (ASX:PPS) | A$0.775 | A$370.23M | ✅ 5 ⚠️ 2 View Analysis > |
| Service Stream (ASX:SSM) | A$2.28 | A$1.4B | ✅ 3 ⚠️ 1 View Analysis > |
Click here to see the full list of 423 stocks from our ASX Penny Stocks screener.
We'll examine a selection from our screener results.
Pancontinental Energy (ASX:PCL)
Simply Wall St Financial Health Rating: ★★★★★★
Overview: Pancontinental Energy NL is involved in the exploration of oil and gas properties in Namibia and Australia, with a market cap of A$82.86 million.
Operations: Pancontinental Energy NL does not report any revenue segments.
Market Cap: A$82.86M
Pancontinental Energy NL, with a market cap of A$82.86 million, is a pre-revenue company focused on oil and gas exploration in Namibia and Australia. The company is currently unprofitable, reporting a net loss of A$1.91 million for the year ended June 30, 2025. Despite being debt-free and having short-term assets exceeding liabilities, Pancontinental's share price remains highly volatile. The board is seasoned with an average tenure of 16.8 years; however, the management team's experience level is unclear due to insufficient data. Recently, Pancontinental was removed from the S&P/ASX Emerging Companies Index.
- Get an in-depth perspective on Pancontinental Energy's performance by reading our balance sheet health report here.
- Explore historical data to track Pancontinental Energy's performance over time in our past results report.
Qualitas (ASX:QAL)
Simply Wall St Financial Health Rating: ★★★★★★
Overview: Qualitas (ASX:QAL) is a real estate investment firm that engages in direct investments across various real estate classes and geographies, distressed debt restructuring, third-party capital raisings, and consulting services, with a market cap of A$1.02 billion.
Operations: The company's revenue is derived from Direct Lending (A$10.17 million) and Funds Management (A$15.03 million).
Market Cap: A$1.02B
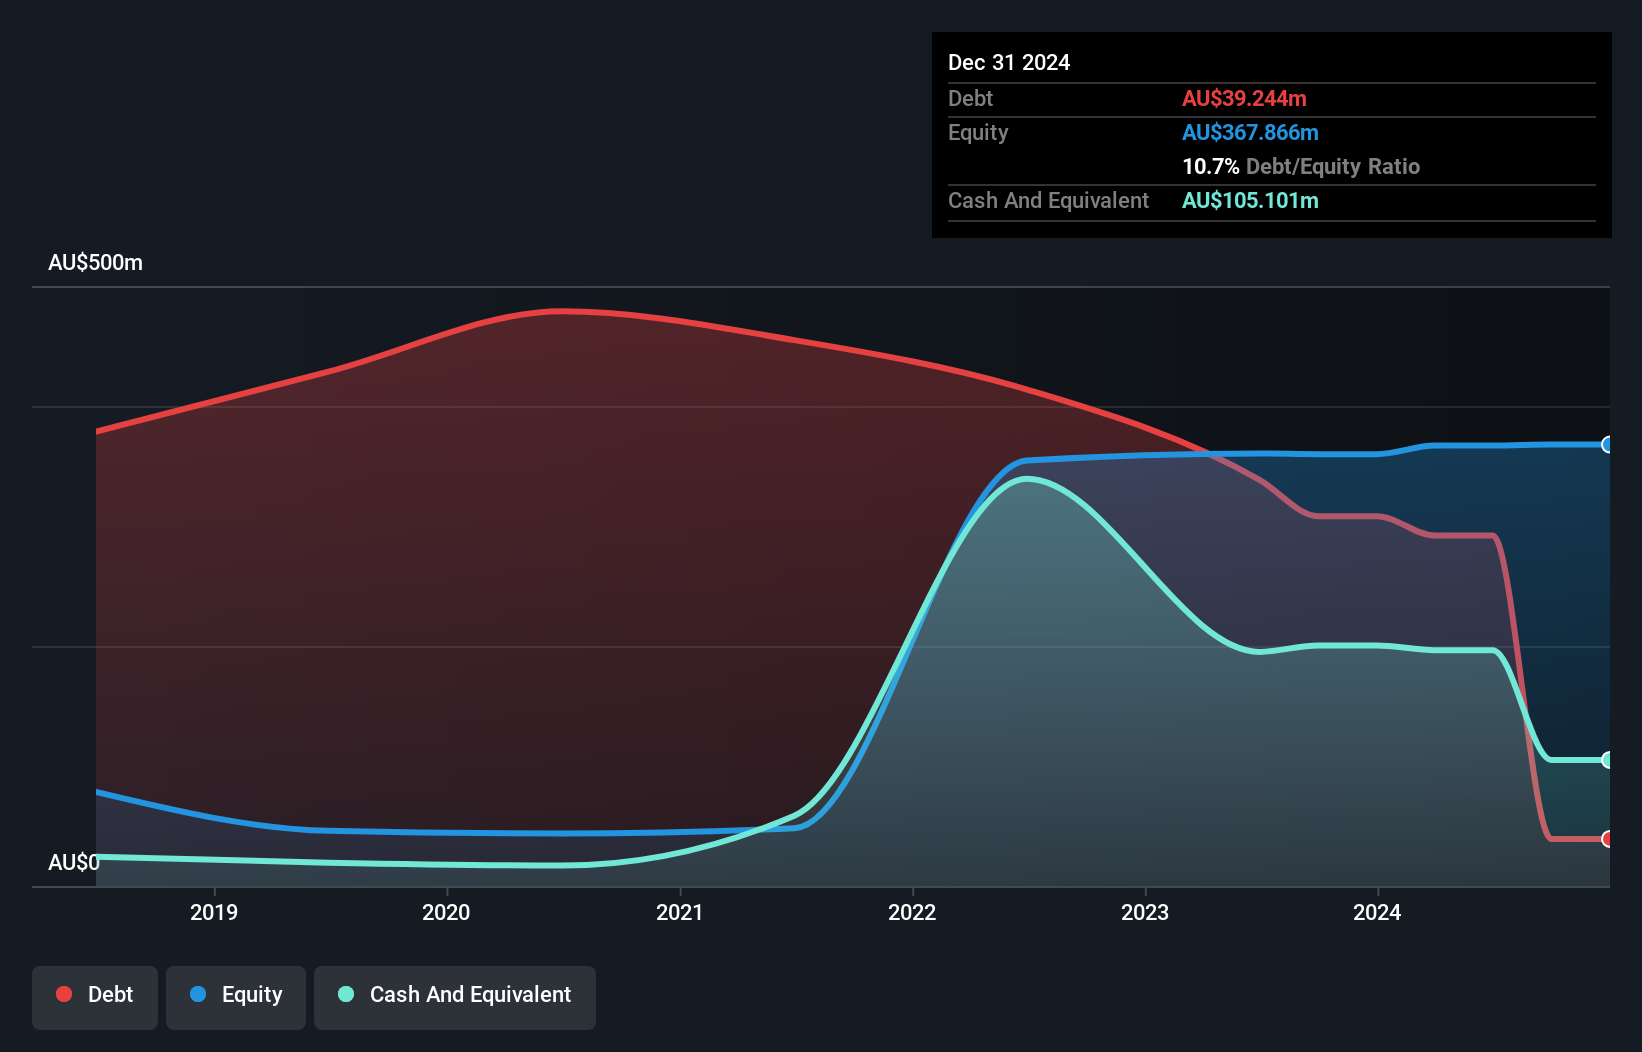
Qualitas, with a market cap of A$1.02 billion, has demonstrated robust financial performance, reporting revenue growth from A$84.02 million to A$109.42 million and net income rising to A$33.41 million for the year ended June 30, 2025. Its earnings growth outpaces the industry average and its short-term assets surpass both short- and long-term liabilities significantly. While debt is well-covered by cash flow and interest payments are comfortably managed by EBIT, its return on equity remains low at 8.8%. Recently added to the S&P Global BMI Index, Qualitas also declared an increased dividend of A$0.075 per share for six months ending June 2025.
- Take a closer look at Qualitas' potential here in our financial health report.
- Understand Qualitas' earnings outlook by examining our growth report.
Tyranna Resources (ASX:TYX)
Simply Wall St Financial Health Rating: ★★★★☆☆
Overview: Tyranna Resources Limited is engaged in the exploration and development of mineral properties both in Australia and internationally, with a market cap of A$20.06 million.
Operations: The company has not reported any revenue segments.
Market Cap: A$20.06M
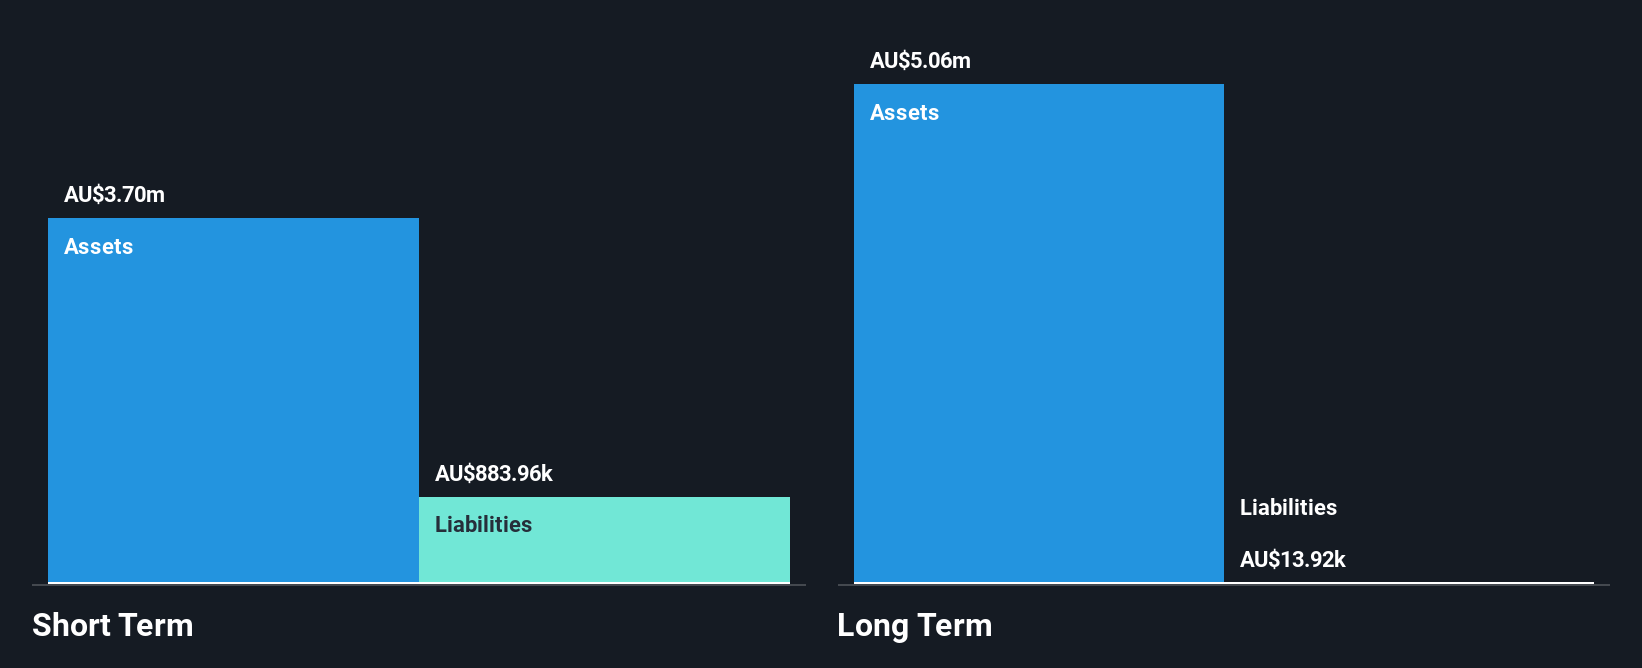
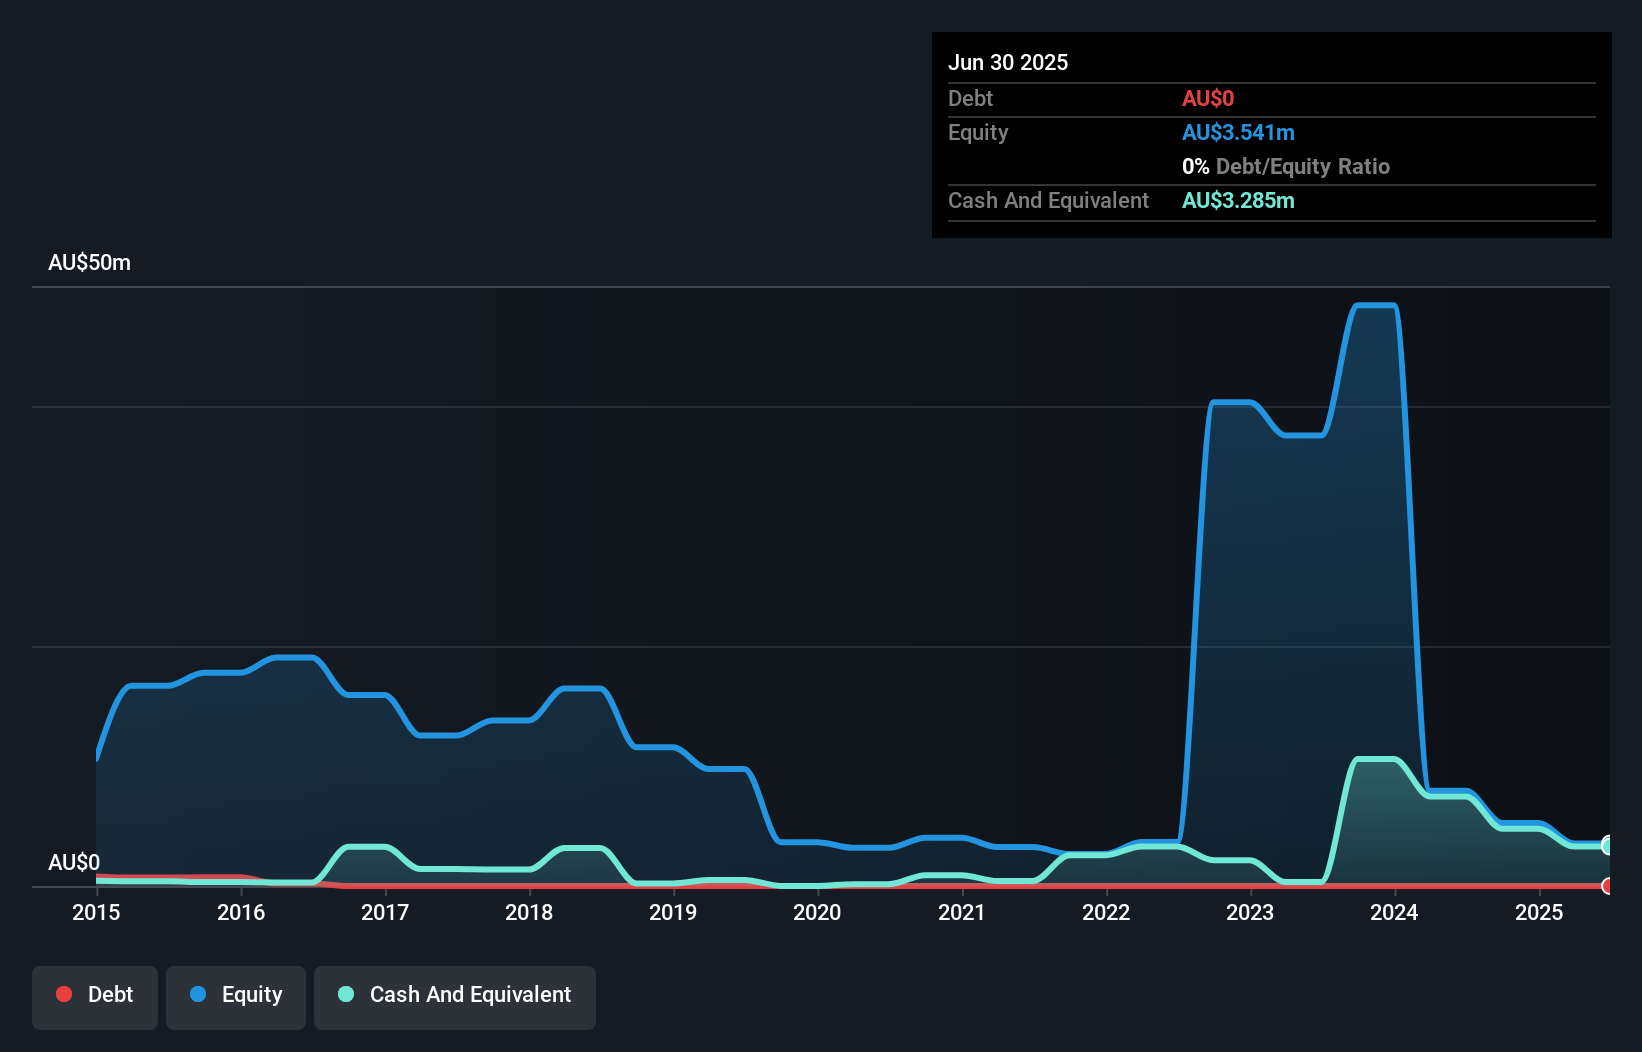
Tyranna Resources, with a market cap of A$20.06 million, is a pre-revenue company in the mineral exploration sector. Despite reporting minimal sales of A$98K for the year ended June 30, 2025, it reduced its net loss significantly to A$3.96 million from A$42.47 million the previous year. The company remains debt-free and has short-term assets of A$3.3 million exceeding its liabilities by a wide margin; however, it faces challenges with less than a year of cash runway if current cash flow trends persist. Its share price remains highly volatile and weekly volatility is higher than most Australian stocks.
- Click to explore a detailed breakdown of our findings in Tyranna Resources' financial health report.
- Examine Tyranna Resources' past performance report to understand how it has performed in prior years.
Where To Now?
- Click through to start exploring the rest of the 420 ASX Penny Stocks now.
- Want To Explore Some Alternatives? These 12 companies survived and thrived after COVID and have the right ingredients to survive Trump's tariffs. Discover why before your portfolio feels the trade war pinch.
This article by Simply Wall St is general in nature. We provide commentary based on historical data and analyst forecasts only using an unbiased methodology and our articles are not intended to be financial advice. It does not constitute a recommendation to buy or sell any stock, and does not take account of your objectives, or your financial situation. We aim to bring you long-term focused analysis driven by fundamental data. Note that our analysis may not factor in the latest price-sensitive company announcements or qualitative material. Simply Wall St has no position in any stocks mentioned.
Valuation is complex, but we're here to simplify it.
Discover if Tyranna Resources might be undervalued or overvalued with our detailed analysis, featuring fair value estimates, potential risks, dividends, insider trades, and its financial condition.
Access Free AnalysisHave feedback on this article? Concerned about the content? Get in touch with us directly. Alternatively, email editorial-team@simplywallst.com
About ASX:TYX
Tyranna Resources
Explores for and develops mineral properties in Australia and internationally.
Moderate risk with adequate balance sheet.
Similar Companies
Market Insights

Advertisement
Community Narratives
A formidable player in AI and enterprise computing.
Fair Value US$210.00|12.2% overvalued
CO
Community Contributor
IREN's Bold Moves in Sustainable Bitcoin Mining & AI Data Centers
Fair Value US$72.52|17.1% undervalued
BL
Community Contributor
Cooling the Champions: The Aussie Tech Behind F1's Victories
Fair Value AU$12.40|38.7% undervalued
TR
Community Contributor