- Australia
- /
- Metals and Mining
- /
- ASX:NST
Investors Still Waiting For A Pull Back In Northern Star Resources Limited (ASX:NST)

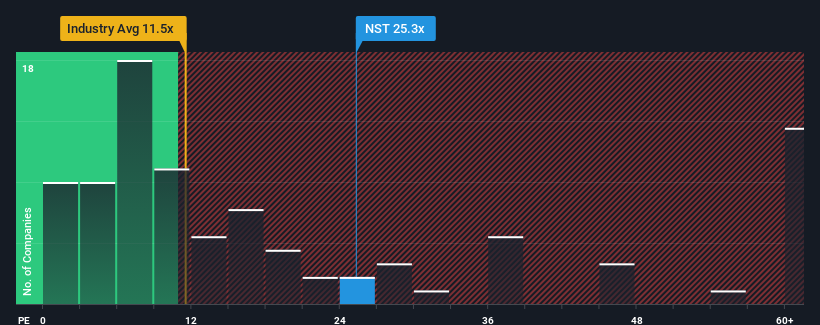
When close to half the companies in Australia have price-to-earnings ratios (or "P/E's") below 18x, you may consider Northern Star Resources Limited (ASX:NST) as a stock to potentially avoid with its 25.3x P/E ratio. Although, it's not wise to just take the P/E at face value as there may be an explanation why it's as high as it is.
Northern Star Resources certainly has been doing a good job lately as its earnings growth has been positive while most other companies have been seeing their earnings go backwards. It seems that many are expecting the company to continue defying the broader market adversity, which has increased investors’ willingness to pay up for the stock. You'd really hope so, otherwise you're paying a pretty hefty price for no particular reason.
Check out our latest analysis for Northern Star Resources

Is There Enough Growth For Northern Star Resources?
In order to justify its P/E ratio, Northern Star Resources would need to produce impressive growth in excess of the market.
Retrospectively, the last year delivered an exceptional 31% gain to the company's bottom line. The strong recent performance means it was also able to grow EPS by 37% in total over the last three years. Therefore, it's fair to say the earnings growth recently has been superb for the company.
Turning to the outlook, the next three years should generate growth of 22% per annum as estimated by the analysts watching the company. That's shaping up to be materially higher than the 17% per annum growth forecast for the broader market.
With this information, we can see why Northern Star Resources is trading at such a high P/E compared to the market. Apparently shareholders aren't keen to offload something that is potentially eyeing a more prosperous future.
What We Can Learn From Northern Star Resources' P/E?
Generally, our preference is to limit the use of the price-to-earnings ratio to establishing what the market thinks about the overall health of a company.
As we suspected, our examination of Northern Star Resources' analyst forecasts revealed that its superior earnings outlook is contributing to its high P/E. At this stage investors feel the potential for a deterioration in earnings isn't great enough to justify a lower P/E ratio. It's hard to see the share price falling strongly in the near future under these circumstances.
We don't want to rain on the parade too much, but we did also find 1 warning sign for Northern Star Resources that you need to be mindful of.
Of course, you might find a fantastic investment by looking at a few good candidates. So take a peek at this free list of companies with a strong growth track record, trading on a low P/E.
Valuation is complex, but we're here to simplify it.
Discover if Northern Star Resources might be undervalued or overvalued with our detailed analysis, featuring fair value estimates, potential risks, dividends, insider trades, and its financial condition.
Access Free AnalysisHave feedback on this article? Concerned about the content? Get in touch with us directly. Alternatively, email editorial-team (at) simplywallst.com.
This article by Simply Wall St is general in nature. We provide commentary based on historical data and analyst forecasts only using an unbiased methodology and our articles are not intended to be financial advice. It does not constitute a recommendation to buy or sell any stock, and does not take account of your objectives, or your financial situation. We aim to bring you long-term focused analysis driven by fundamental data. Note that our analysis may not factor in the latest price-sensitive company announcements or qualitative material. Simply Wall St has no position in any stocks mentioned.
About ASX:NST
Northern Star Resources
Engages in the exploration, development, mining, and processing of gold deposits.
Adequate balance sheet average dividend payer.
Similar Companies
Market Insights
Community Narratives


