- Australia
- /
- Metals and Mining
- /
- ASX:ILU
Is Iluka Resources Set for More Growth After 56% Price Surge in Early 2025?

Reviewed by Simply Wall St
Approach 1: Iluka Resources Cash Flows
A Discounted Cash Flow (DCF) model estimates what a company is really worth by projecting its future cash flows and then bringing those numbers back to today’s value. This approach aims to reveal whether a stock is undervalued or overvalued compared to its intrinsic worth.
For Iluka Resources, the latest twelve months’ Free Cash Flow (FCF) stands at negative A$305 million. However, analyst expectations and projections suggest a sharp turnaround. Looking ten years ahead to 2035, Iluka’s FCF is expected to rise to roughly A$1.3 billion. This projection shows a dramatic improvement from current levels as the business gains momentum.
By entering these numbers into a two-stage DCF model, the estimated intrinsic value is A$42.31 per share. Today’s market price suggests the stock is trading at an 85.6% discount to its DCF fair value. This result indicates that the market may be significantly underestimating its future cash-generating potential.
In simple terms, Iluka Resources appears substantially undervalued by cash flow metrics, making its shares look appealing to long-term investors focused on fundamentals.
Result: UNDERVALUED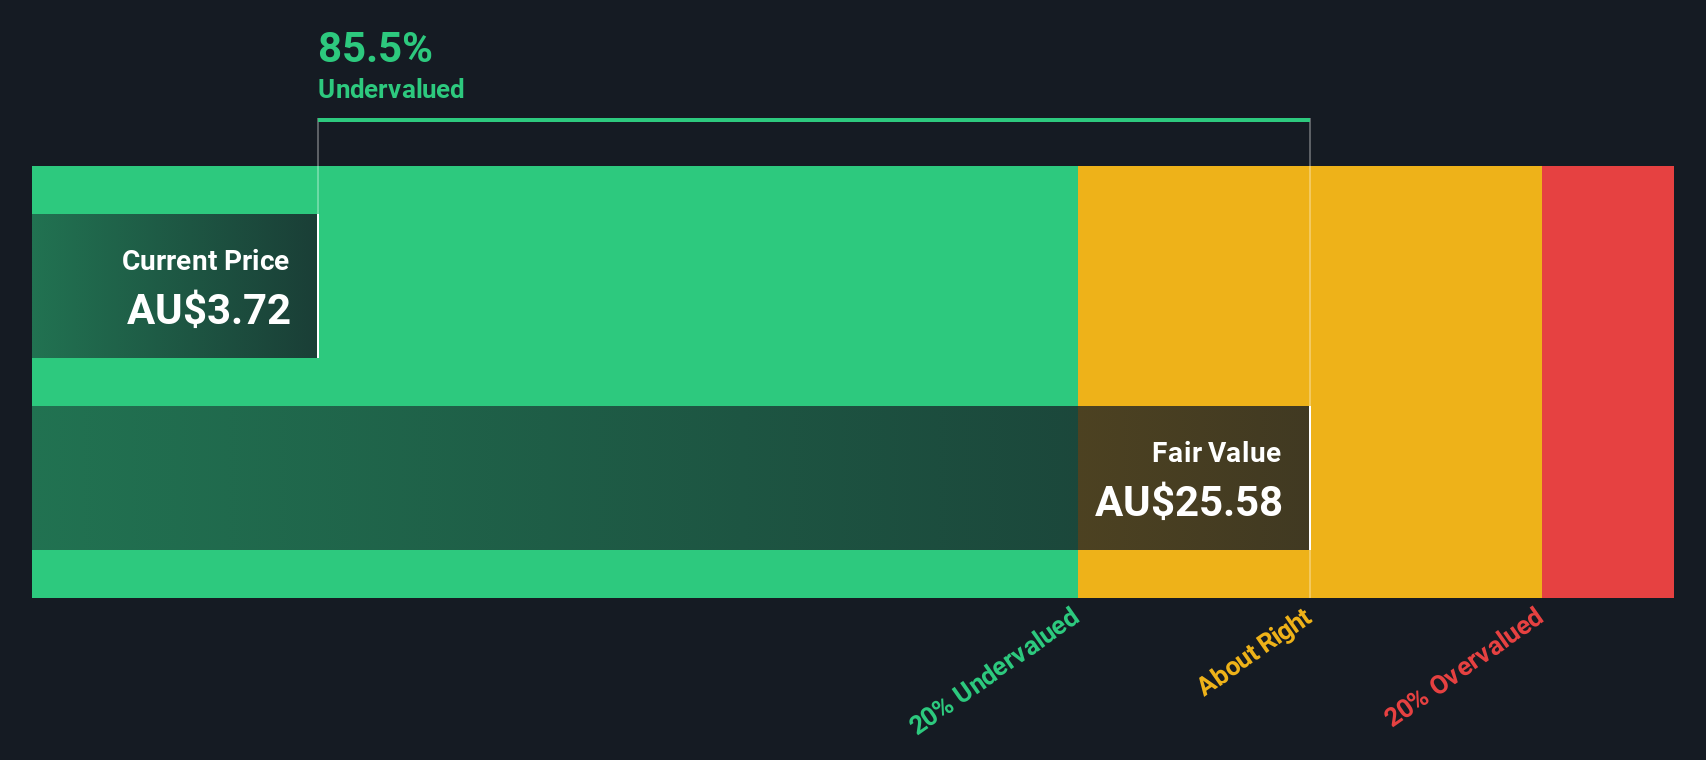
Approach 2: Iluka Resources Price vs Earnings
The Price-to-Earnings (PE) ratio is a core valuation tool, especially when analyzing profitable companies like Iluka Resources. It provides a direct reflection of what investors are willing to pay for every dollar of a company’s current earnings, making it useful for judging whether a stock is expensive or a bargain relative to its profits.
When using PE ratios, higher numbers can indicate that the market expects faster growth or sees the company as less risky compared to its peers. Lower ratios might mean slower growth expectations or higher perceived risks. It is important to compare a company’s PE not just to its own history but also to its industry and close competitors for proper context.
Iluka Resources is currently trading at a PE ratio of 13.75x. This is slightly below the Metals and Mining industry average of 14.26x and well below the peer group average of 22.71x. For further context, Simply Wall St’s Fair Ratio for Iluka is calculated at 14.41x. This Fair Ratio considers a blend of factors including Iluka’s earnings outlook, business model, and risk profile.
Given that Iluka’s current PE ratio is within 0.1 of the Fair Ratio, it suggests the stock is trading close to its justifiable value based on earnings. This means Iluka appears to be valued appropriately from a PE perspective.
Result: ABOUT RIGHT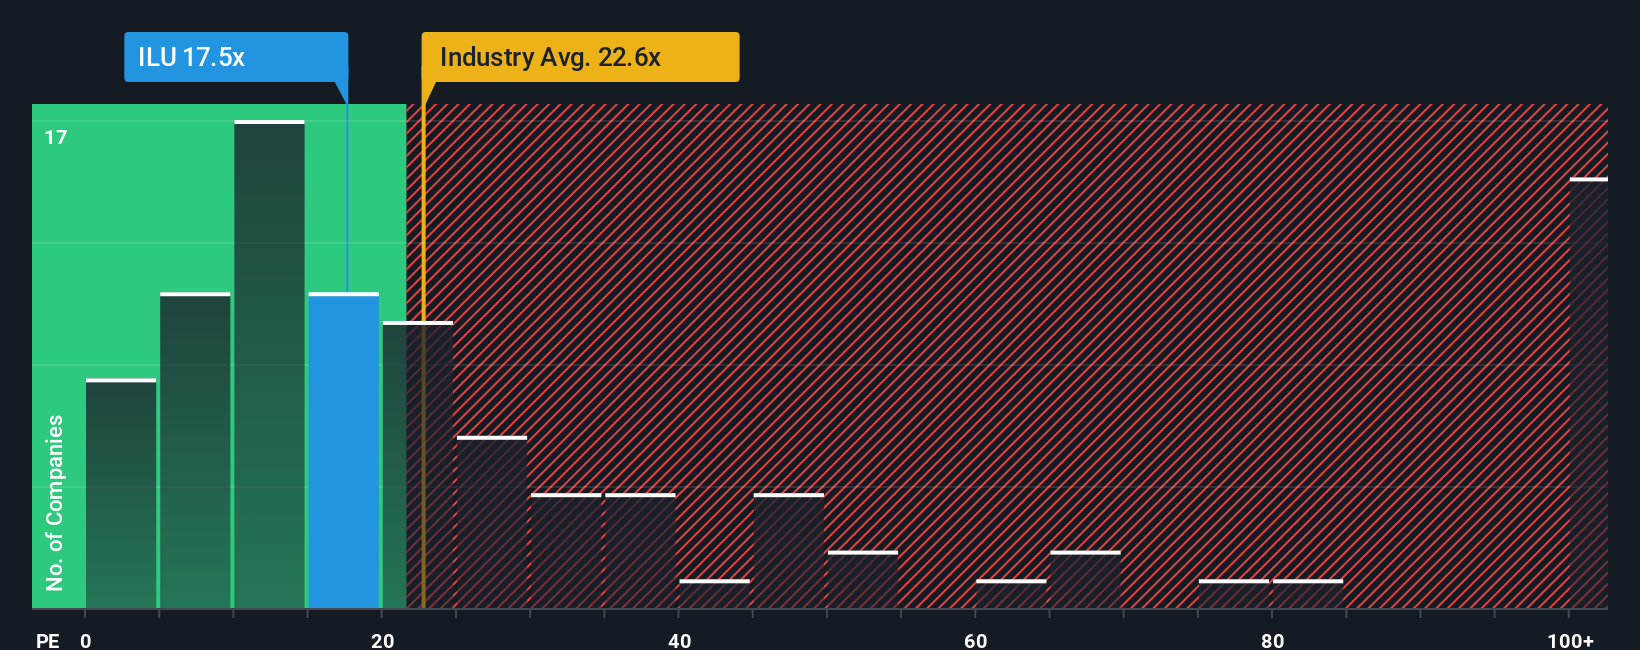
Upgrade Your Decision Making: Choose your Iluka Resources Narrative
A Narrative is simply your story about a company. It is your perspective on where Iluka Resources is headed, combining what you believe about its future revenue, earnings, and margins with your estimate of fair value. Narratives connect the dots between a company’s story, your forecast, and a resulting fair value. This gives you a more personalized and holistic investment decision process that goes beyond just numbers.
On the Simply Wall St platform, Narratives are an easy and accessible tool used by millions of investors to clarify what really matters for each stock. By using Narratives, you can track your own reasoning, see how your view compares to others, and check if your fair value aligns with today’s share price. This can help you decide when to act.
Narratives update dynamically as fresh news or earnings become available, ensuring you always operate with the latest information. For example, some Iluka Resources investors may see its new project investments and potential in rare earths and forecast a high future fair value. Others, focusing on cost pressures or earnings risks, may use more conservative assumptions and arrive at a much lower value. Narratives let you make these perspectives explicit and action-oriented in your investment decisions.
Do you think there's more to the story for Iluka Resources? Create your own Narrative to let the Community know!
This article by Simply Wall St is general in nature. We provide commentary based on historical data and analyst forecasts only using an unbiased methodology and our articles are not intended to be financial advice. It does not constitute a recommendation to buy or sell any stock, and does not take account of your objectives, or your financial situation. We aim to bring you long-term focused analysis driven by fundamental data. Note that our analysis may not factor in the latest price-sensitive company announcements or qualitative material. Simply Wall St has no position in any stocks mentioned.
The New Payments ETF Is Live on NASDAQ:
Money is moving to real-time rails, and a newly listed ETF now gives investors direct exposure. Fast settlement. Institutional custody. Simple access.
Explore how this launch could reshape portfolios
Sponsored ContentNew: AI Stock Screener & Alerts
Our new AI Stock Screener scans the market every day to uncover opportunities.
• Dividend Powerhouses (3%+ Yield)
• Undervalued Small Caps with Insider Buying
• High growth Tech and AI Companies
Or build your own from over 50 metrics.
Have feedback on this article? Concerned about the content? Get in touch with us directly. Alternatively, email editorial-team@simplywallst.com
About ASX:ILU
Iluka Resources
Engages in the exploration, project development, mining, processing, marketing, and rehabilitation of mineral sands in Australia, China, rest of Asia, Europe, the Americas, and internationally.
Very undervalued with moderate growth potential.
Similar Companies
Market Insights

Weekly Picks

THE KINGDOM OF BROWN GOODS: WHY MGPI IS BEING CRUSHED BY INVENTORY & PRIMED FOR RESURRECTION


Why Vertical Aerospace (NYSE: EVTL) is Worth Possibly Over 13x its Current Price


The Quiet Giant That Became AI’s Power Grid
Recently Updated Narratives


A tech powerhouse quietly powering the world’s AI infrastructure.


Keppel DC REIT (SGX: AJBU) is a resilient gem in the data center space.
Why Vertical Aerospace (NYSE: EVTL) is Worth Possibly Over 13x its Current Price
Popular Narratives

MicroVision will explode future revenue by 380.37% with a vision towards success


Crazy Undervalued 42 Baggers Silver Play (Active & Running Mine)


