- Australia
- /
- Metals and Mining
- /
- ASX:PRG
These 4 Measures Indicate That CI Resources (ASX:CII) Is Using Debt Reasonably Well

Some say volatility, rather than debt, is the best way to think about risk as an investor, but Warren Buffett famously said that 'Volatility is far from synonymous with risk.' When we think about how risky a company is, we always like to look at its use of debt, since debt overload can lead to ruin. We note that CI Resources Limited (ASX:CII) does have debt on its balance sheet. But the real question is whether this debt is making the company risky.
When Is Debt Dangerous?
Debt and other liabilities become risky for a business when it cannot easily fulfill those obligations, either with free cash flow or by raising capital at an attractive price. Part and parcel of capitalism is the process of 'creative destruction' where failed businesses are mercilessly liquidated by their bankers. However, a more frequent (but still costly) occurrence is where a company must issue shares at bargain-basement prices, permanently diluting shareholders, just to shore up its balance sheet. Of course, debt can be an important tool in businesses, particularly capital heavy businesses. When we think about a company's use of debt, we first look at cash and debt together.
See our latest analysis for CI Resources
What Is CI Resources's Net Debt?
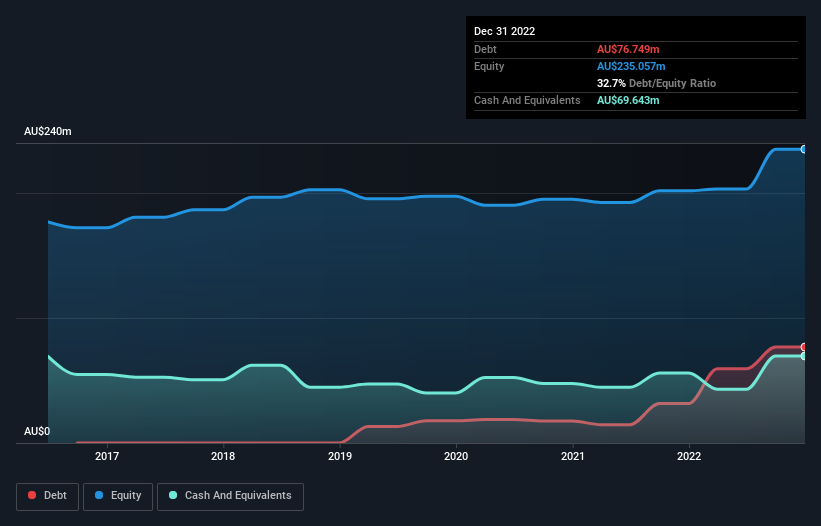
You can click the graphic below for the historical numbers, but it shows that as of December 2022 CI Resources had AU$76.7m of debt, an increase on AU$31.5m, over one year. On the flip side, it has AU$69.6m in cash leading to net debt of about AU$7.11m.
How Strong Is CI Resources' Balance Sheet?
According to the last reported balance sheet, CI Resources had liabilities of AU$203.8m due within 12 months, and liabilities of AU$35.8m due beyond 12 months. On the other hand, it had cash of AU$69.6m and AU$192.6m worth of receivables due within a year. So it actually has AU$22.7m more liquid assets than total liabilities.
It's good to see that CI Resources has plenty of liquidity on its balance sheet, suggesting conservative management of liabilities. Because it has plenty of assets, it is unlikely to have trouble with its lenders.
In order to size up a company's debt relative to its earnings, we calculate its net debt divided by its earnings before interest, tax, depreciation, and amortization (EBITDA) and its earnings before interest and tax (EBIT) divided by its interest expense (its interest cover). The advantage of this approach is that we take into account both the absolute quantum of debt (with net debt to EBITDA) and the actual interest expenses associated with that debt (with its interest cover ratio).
CI Resources's net debt is only 0.16 times its EBITDA. And its EBIT easily covers its interest expense, being 13.8 times the size. So we're pretty relaxed about its super-conservative use of debt. Better yet, CI Resources grew its EBIT by 410% last year, which is an impressive improvement. If maintained that growth will make the debt even more manageable in the years ahead. When analysing debt levels, the balance sheet is the obvious place to start. But it is CI Resources's earnings that will influence how the balance sheet holds up in the future. So if you're keen to discover more about its earnings, it might be worth checking out this graph of its long term earnings trend.
Finally, while the tax-man may adore accounting profits, lenders only accept cold hard cash. So we always check how much of that EBIT is translated into free cash flow. Over the last three years, CI Resources saw substantial negative free cash flow, in total. While that may be a result of expenditure for growth, it does make the debt far more risky.
Our View
The good news is that CI Resources's demonstrated ability to cover its interest expense with its EBIT delights us like a fluffy puppy does a toddler. But the stark truth is that we are concerned by its conversion of EBIT to free cash flow. Taking all this data into account, it seems to us that CI Resources takes a pretty sensible approach to debt. While that brings some risk, it can also enhance returns for shareholders. When analysing debt levels, the balance sheet is the obvious place to start. However, not all investment risk resides within the balance sheet - far from it. Be aware that CI Resources is showing 5 warning signs in our investment analysis , and 3 of those are concerning...
At the end of the day, it's often better to focus on companies that are free from net debt. You can access our special list of such companies (all with a track record of profit growth). It's free.
The New Payments ETF Is Live on NASDAQ:
Money is moving to real-time rails, and a newly listed ETF now gives investors direct exposure. Fast settlement. Institutional custody. Simple access.
Explore how this launch could reshape portfolios
Sponsored ContentNew: Manage All Your Stock Portfolios in One Place
We've created the ultimate portfolio companion for stock investors, and it's free.
• Connect an unlimited number of Portfolios and see your total in one currency
• Be alerted to new Warning Signs or Risks via email or mobile
• Track the Fair Value of your stocks
Have feedback on this article? Concerned about the content? Get in touch with us directly. Alternatively, email editorial-team (at) simplywallst.com.
This article by Simply Wall St is general in nature. We provide commentary based on historical data and analyst forecasts only using an unbiased methodology and our articles are not intended to be financial advice. It does not constitute a recommendation to buy or sell any stock, and does not take account of your objectives, or your financial situation. We aim to bring you long-term focused analysis driven by fundamental data. Note that our analysis may not factor in the latest price-sensitive company announcements or qualitative material. Simply Wall St has no position in any stocks mentioned.
About ASX:PRG
PRL Global
Engages in the mining, processing, and sale of phosphate rock, phosphate dust, and chalk in Africa, Asia, Europe, Australia, the United States, and Oceania.
Solid track record average dividend payer.
Market Insights

Weekly Picks

THE KINGDOM OF BROWN GOODS: WHY MGPI IS BEING CRUSHED BY INVENTORY & PRIMED FOR RESURRECTION


Why Vertical Aerospace (NYSE: EVTL) is Worth Possibly Over 13x its Current Price


The Quiet Giant That Became AI’s Power Grid
Recently Updated Narratives

Jackson Financial Stock: When Insurance Math Meets a Shifting Claims Landscape

Stride Stock: Online Education Finds Its Second Act

CS Disco Stock: Legal AI Is Moving From Efficiency Tool to Competitive Necessity
Popular Narratives


MicroVision will explode future revenue by 380.37% with a vision towards success


Crazy Undervalued 42 Baggers Silver Play (Active & Running Mine)


