
What are the early trends we should look for to identify a stock that could multiply in value over the long term? Ideally, a business will show two trends; firstly a growing return on capital employed (ROCE) and secondly, an increasing amount of capital employed. Ultimately, this demonstrates that it's a business that is reinvesting profits at increasing rates of return. So when we looked at CI Resources (ASX:CII) and its trend of ROCE, we really liked what we saw.
Understanding Return On Capital Employed (ROCE)
If you haven't worked with ROCE before, it measures the 'return' (pre-tax profit) a company generates from capital employed in its business. To calculate this metric for CI Resources, this is the formula:
Return on Capital Employed = Earnings Before Interest and Tax (EBIT) ÷ (Total Assets - Current Liabilities)
0.18 = AU$51m ÷ (AU$469m - AU$191m) (Based on the trailing twelve months to June 2023).
So, CI Resources has an ROCE of 18%. On its own, that's a standard return, however it's much better than the 9.0% generated by the Metals and Mining industry.
See our latest analysis for CI Resources
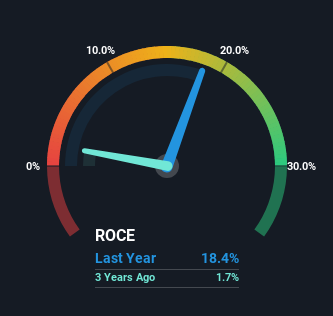
Historical performance is a great place to start when researching a stock so above you can see the gauge for CI Resources' ROCE against it's prior returns. If you're interested in investigating CI Resources' past further, check out this free graph of past earnings, revenue and cash flow.
What Can We Tell From CI Resources' ROCE Trend?
Investors would be pleased with what's happening at CI Resources. The numbers show that in the last five years, the returns generated on capital employed have grown considerably to 18%. The amount of capital employed has increased too, by 24%. This can indicate that there's plenty of opportunities to invest capital internally and at ever higher rates, a combination that's common among multi-baggers.
On a side note, we noticed that the improvement in ROCE appears to be partly fueled by an increase in current liabilities. Effectively this means that suppliers or short-term creditors are now funding 41% of the business, which is more than it was five years ago. And with current liabilities at those levels, that's pretty high.
Our Take On CI Resources' ROCE
In summary, it's great to see that CI Resources can compound returns by consistently reinvesting capital at increasing rates of return, because these are some of the key ingredients of those highly sought after multi-baggers. Considering the stock has delivered 28% to its stockholders over the last five years, it may be fair to think that investors aren't fully aware of the promising trends yet. So exploring more about this stock could uncover a good opportunity, if the valuation and other metrics stack up.
If you want to continue researching CI Resources, you might be interested to know about the 2 warning signs that our analysis has discovered.
While CI Resources isn't earning the highest return, check out this free list of companies that are earning high returns on equity with solid balance sheets.
The New Payments ETF Is Live on NASDAQ:
Money is moving to real-time rails, and a newly listed ETF now gives investors direct exposure. Fast settlement. Institutional custody. Simple access.
Explore how this launch could reshape portfolios
Sponsored ContentNew: Manage All Your Stock Portfolios in One Place
We've created the ultimate portfolio companion for stock investors, and it's free.
• Connect an unlimited number of Portfolios and see your total in one currency
• Be alerted to new Warning Signs or Risks via email or mobile
• Track the Fair Value of your stocks
Have feedback on this article? Concerned about the content? Get in touch with us directly. Alternatively, email editorial-team (at) simplywallst.com.
This article by Simply Wall St is general in nature. We provide commentary based on historical data and analyst forecasts only using an unbiased methodology and our articles are not intended to be financial advice. It does not constitute a recommendation to buy or sell any stock, and does not take account of your objectives, or your financial situation. We aim to bring you long-term focused analysis driven by fundamental data. Note that our analysis may not factor in the latest price-sensitive company announcements or qualitative material. Simply Wall St has no position in any stocks mentioned.
About ASX:PRG
PRL Global
Engages in the mining, processing, and sale of phosphate rock, phosphate dust, and chalk in Africa, Asia, Europe, Australia, the United States, and Oceania.
Solid track record average dividend payer.
Market Insights

Weekly Picks

THE KINGDOM OF BROWN GOODS: WHY MGPI IS BEING CRUSHED BY INVENTORY & PRIMED FOR RESURRECTION


Why Vertical Aerospace (NYSE: EVTL) is Worth Possibly Over 13x its Current Price


The Quiet Giant That Became AI’s Power Grid
Recently Updated Narratives

Butler National (Buks) outperforms.


A tech powerhouse quietly powering the world’s AI infrastructure.


Keppel DC REIT (SGX: AJBU) is a resilient gem in the data center space.
Popular Narratives

MicroVision will explode future revenue by 380.37% with a vision towards success


Crazy Undervalued 42 Baggers Silver Play (Active & Running Mine)


