Top Shelf International Holdings Ltd (ASX:TSI) Might Not Be As Mispriced As It Looks After Plunging 29%


The Top Shelf International Holdings Ltd (ASX:TSI) share price has fared very poorly over the last month, falling by a substantial 29%. The recent drop completes a disastrous twelve months for shareholders, who are sitting on a 65% loss during that time.
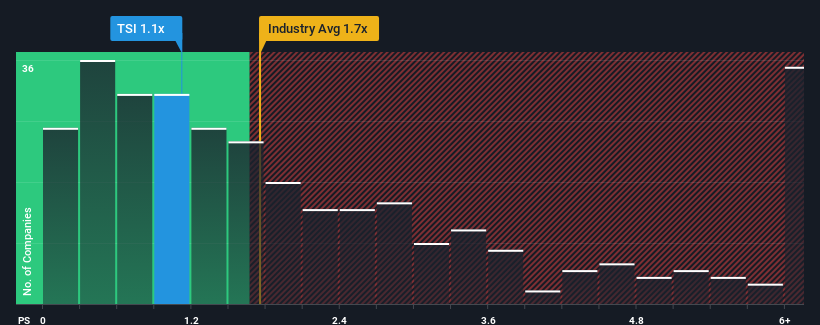
Although its price has dipped substantially, there still wouldn't be many who think Top Shelf International Holdings' price-to-sales (or "P/S") ratio of 1.1x is worth a mention when the median P/S in Australia's Beverage industry is similar at about 0.8x. While this might not raise any eyebrows, if the P/S ratio is not justified investors could be missing out on a potential opportunity or ignoring looming disappointment.
Check out our latest analysis for Top Shelf International Holdings
What Does Top Shelf International Holdings' P/S Mean For Shareholders?
Top Shelf International Holdings has been doing a good job lately as it's been growing revenue at a solid pace. Perhaps the market is expecting future revenue performance to only keep up with the broader industry, which has keeping the P/S in line with expectations. If you like the company, you'd be hoping this isn't the case so that you could potentially pick up some stock while it's not quite in favour.
Want the full picture on earnings, revenue and cash flow for the company? Then our free report on Top Shelf International Holdings will help you shine a light on its historical performance.How Is Top Shelf International Holdings' Revenue Growth Trending?
There's an inherent assumption that a company should be matching the industry for P/S ratios like Top Shelf International Holdings' to be considered reasonable.
Retrospectively, the last year delivered a decent 10% gain to the company's revenues. This was backed up an excellent period prior to see revenue up by 49% in total over the last three years. So we can start by confirming that the company has done a great job of growing revenues over that time.
Comparing that recent medium-term revenue trajectory with the industry's one-year growth forecast of 9.6% shows it's noticeably more attractive.
With this information, we find it interesting that Top Shelf International Holdings is trading at a fairly similar P/S compared to the industry. Apparently some shareholders believe the recent performance is at its limits and have been accepting lower selling prices.
The Final Word
Following Top Shelf International Holdings' share price tumble, its P/S is just clinging on to the industry median P/S. We'd say the price-to-sales ratio's power isn't primarily as a valuation instrument but rather to gauge current investor sentiment and future expectations.
We didn't quite envision Top Shelf International Holdings' P/S sitting in line with the wider industry, considering the revenue growth over the last three-year is higher than the current industry outlook. When we see strong revenue with faster-than-industry growth, we can only assume potential risks are what might be placing pressure on the P/S ratio. While recent revenue trends over the past medium-term suggest that the risk of a price decline is low, investors appear to see the likelihood of revenue fluctuations in the future.
There are also other vital risk factors to consider and we've discovered 4 warning signs for Top Shelf International Holdings (3 can't be ignored!) that you should be aware of before investing here.
Of course, profitable companies with a history of great earnings growth are generally safer bets. So you may wish to see this free collection of other companies that have reasonable P/E ratios and have grown earnings strongly.
If you're looking to trade Top Shelf International Holdings, open an account with the lowest-cost platform trusted by professionals, Interactive Brokers.
With clients in over 200 countries and territories, and access to 160 markets, IBKR lets you trade stocks, options, futures, forex, bonds and funds from a single integrated account.
Enjoy no hidden fees, no account minimums, and FX conversion rates as low as 0.03%, far better than what most brokers offer.
Sponsored ContentValuation is complex, but we're here to simplify it.
Discover if Top Shelf International Holdings might be undervalued or overvalued with our detailed analysis, featuring fair value estimates, potential risks, dividends, insider trades, and its financial condition.
Access Free AnalysisHave feedback on this article? Concerned about the content? Get in touch with us directly. Alternatively, email editorial-team (at) simplywallst.com.
This article by Simply Wall St is general in nature. We provide commentary based on historical data and analyst forecasts only using an unbiased methodology and our articles are not intended to be financial advice. It does not constitute a recommendation to buy or sell any stock, and does not take account of your objectives, or your financial situation. We aim to bring you long-term focused analysis driven by fundamental data. Note that our analysis may not factor in the latest price-sensitive company announcements or qualitative material. Simply Wall St has no position in any stocks mentioned.
About ASX:TSI
Top Shelf International Holdings
Engages in the production, marketing, and selling of NED Australian Whisky and Grainshaker Hand Made Vodka spirit products in Australia.
Moderate and slightly overvalued.
Market Insights

Community Narratives
