- Australia
- /
- Oil and Gas
- /
- ASX:OEL
3 Promising ASX Penny Stocks Under A$900M Market Cap

Reviewed by Simply Wall St

The Australian market is showing resilience, with the ASX futures indicating a positive start following Wall Street's mixed performance after Moody’s credit downgrade for the US. In such a climate, investors often turn to smaller or newer companies for potential growth opportunities, making penny stocks an area of interest despite their somewhat dated terminology. These stocks can offer surprising value when backed by solid financial foundations, and in this article, we explore several that stand out for their financial strength and potential for long-term success.
Top 10 Penny Stocks In Australia
| Name | Share Price | Market Cap | Rewards & Risks |
| Lindsay Australia (ASX:LAU) | A$0.71 | A$225.19M | ✅ 4 ⚠️ 2 View Analysis > |
| CTI Logistics (ASX:CLX) | A$1.815 | A$146.19M | ✅ 4 ⚠️ 2 View Analysis > |
| Accent Group (ASX:AX1) | A$1.94 | A$1.17B | ✅ 4 ⚠️ 2 View Analysis > |
| EZZ Life Science Holdings (ASX:EZZ) | A$1.55 | A$73.12M | ✅ 4 ⚠️ 2 View Analysis > |
| IVE Group (ASX:IGL) | A$2.60 | A$400.87M | ✅ 4 ⚠️ 2 View Analysis > |
| GTN (ASX:GTN) | A$0.61 | A$116.55M | ✅ 3 ⚠️ 2 View Analysis > |
| West African Resources (ASX:WAF) | A$2.29 | A$2.61B | ✅ 4 ⚠️ 1 View Analysis > |
| Bisalloy Steel Group (ASX:BIS) | A$3.37 | A$159.91M | ✅ 3 ⚠️ 1 View Analysis > |
| Regal Partners (ASX:RPL) | A$2.29 | A$769.82M | ✅ 4 ⚠️ 4 View Analysis > |
| Navigator Global Investments (ASX:NGI) | A$1.80 | A$882.14M | ✅ 5 ⚠️ 3 View Analysis > |
Click here to see the full list of 997 stocks from our ASX Penny Stocks screener.
Let's explore several standout options from the results in the screener.
Bubs Australia (ASX:BUB)
Simply Wall St Financial Health Rating: ★★★★☆☆
Overview: Bubs Australia Limited, with a market cap of A$111.64 million, manufactures and sells infant nutrition and wellbeing products in Australia, China, the United States, and internationally.
Operations: The company's revenue is derived from its Food Processing segment, which generated A$88.82 million.
Market Cap: A$111.64M
Bubs Australia Limited, with a market cap of A$111.64 million, has shown improvement in its financial performance, reporting a net income of A$3.55 million for the half year ended December 31, 2024, compared to a net loss previously. The company trades significantly below its estimated fair value and maintains more cash than debt. Short-term assets cover both short- and long-term liabilities comfortably. Despite being unprofitable over the past five years with increasing losses, Bubs forecasts robust earnings growth of 86% annually and reaffirmed revenue guidance for fiscal year 2025 at A$102 million.
- Navigate through the intricacies of Bubs Australia with our comprehensive balance sheet health report here.
- Understand Bubs Australia's earnings outlook by examining our growth report.
Navigator Global Investments (ASX:NGI)
Simply Wall St Financial Health Rating: ★★★★★☆
Overview: Navigator Global Investments, operating as HFA Holdings Limited, is a fund management company based in Australia with a market cap of A$882.14 million.
Operations: The company generates revenue primarily through its Lighthouse segment, which accounts for $137.95 million.
Market Cap: A$882.14M
Navigator Global Investments, with a market cap of A$882.14 million, recently upgraded its FY2025 earnings outlook due to stronger-than-expected profit distributions from partner firms. Despite trading at 51% below its estimated fair value and having stable weekly volatility (6%), the company faces challenges with unstable dividends and declining earnings forecasted at an average of 11.6% per year over the next three years. However, it maintains a healthy financial position with more cash than debt and short-term assets exceeding liabilities. The management team is experienced, but large one-off gains have impacted recent financial results significantly.
- Jump into the full analysis health report here for a deeper understanding of Navigator Global Investments.
- Examine Navigator Global Investments' earnings growth report to understand how analysts expect it to perform.

Otto Energy (ASX:OEL)
Simply Wall St Financial Health Rating: ★★★★★★
Overview: Otto Energy Limited is an oil and gas exploration, production, and sales company operating in North America with a market cap of A$57.54 million.
Operations: The company's revenue is primarily derived from its oil and gas exploration and production segment, totaling $17.61 million.
Market Cap: A$57.54M
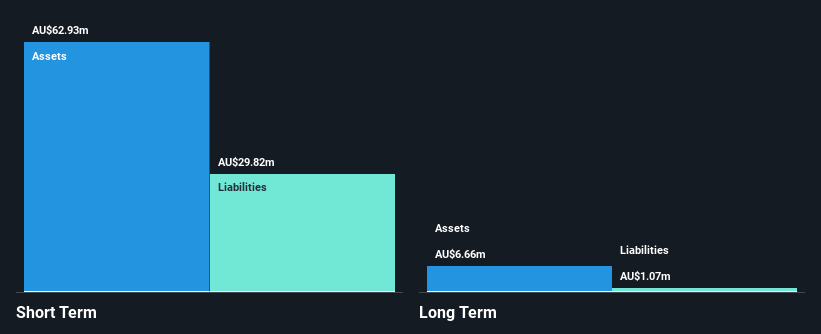
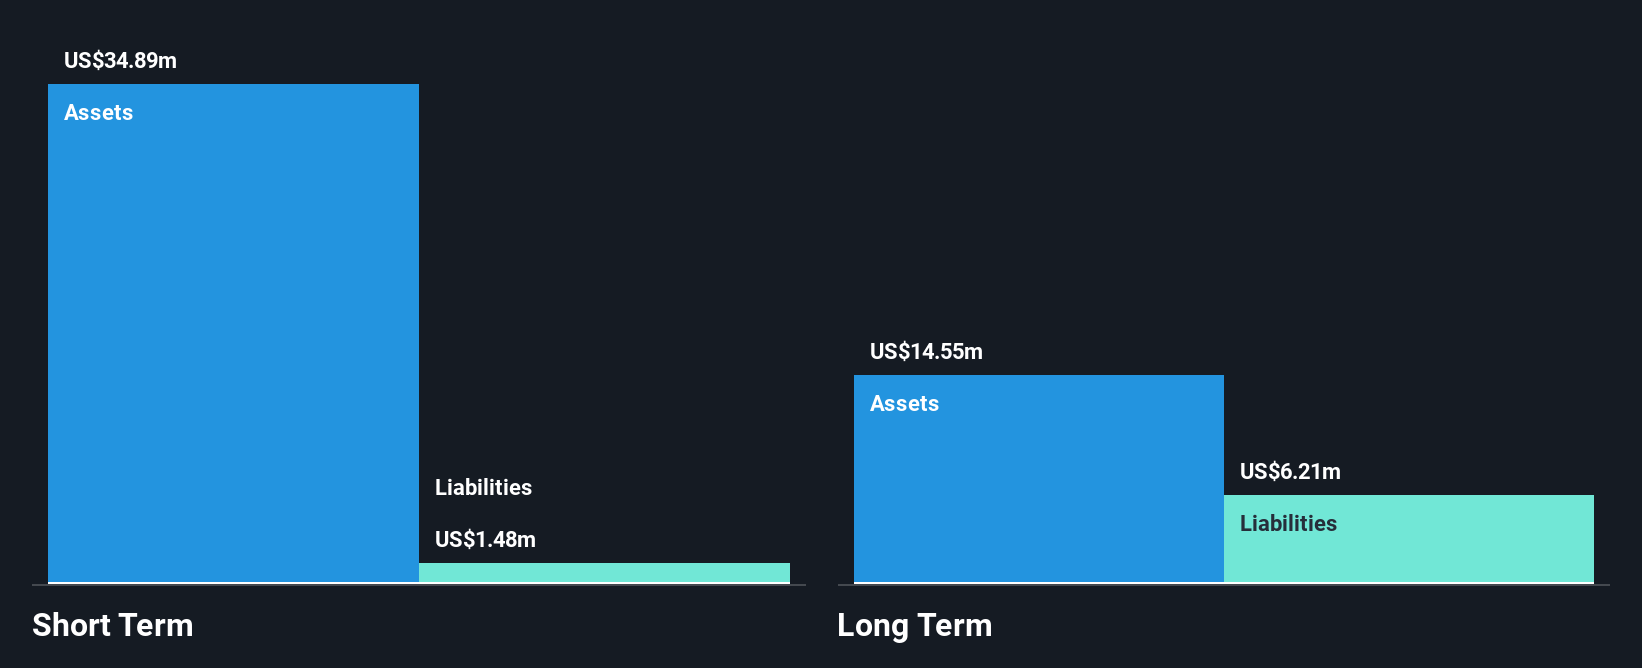
Otto Energy, with a market cap of A$57.54 million, has seen reduced losses over the past five years by 1.6% annually, despite remaining unprofitable. The company reported sales of US$8.16 million for the half year ending December 2024, down from US$10.91 million a year prior, alongside a net loss reduction to US$5 million from US$5.58 million. Otto's short-term assets of $34.9M comfortably cover both short and long-term liabilities and it remains debt-free with sufficient cash runway for over three years based on current free cash flow trends amidst high share price volatility and stable weekly volatility at 15%.
- Unlock comprehensive insights into our analysis of Otto Energy stock in this financial health report.
- Examine Otto Energy's past performance report to understand how it has performed in prior years.
Where To Now?
- Click here to access our complete index of 997 ASX Penny Stocks.
- Ready For A Different Approach? AI is about to change healthcare. These 21 stocks are working on everything from early diagnostics to drug discovery. The best part - they are all under $10b in market cap - there's still time to get in early.
This article by Simply Wall St is general in nature. We provide commentary based on historical data and analyst forecasts only using an unbiased methodology and our articles are not intended to be financial advice. It does not constitute a recommendation to buy or sell any stock, and does not take account of your objectives, or your financial situation. We aim to bring you long-term focused analysis driven by fundamental data. Note that our analysis may not factor in the latest price-sensitive company announcements or qualitative material. Simply Wall St has no position in any stocks mentioned.
If you're looking to trade Otto Energy, open an account with the lowest-cost platform trusted by professionals, Interactive Brokers.
With clients in over 200 countries and territories, and access to 160 markets, IBKR lets you trade stocks, options, futures, forex, bonds and funds from a single integrated account.
Enjoy no hidden fees, no account minimums, and FX conversion rates as low as 0.03%, far better than what most brokers offer.
Sponsored ContentNew: AI Stock Screener & Alerts
Our new AI Stock Screener scans the market every day to uncover opportunities.
• Dividend Powerhouses (3%+ Yield)
• Undervalued Small Caps with Insider Buying
• High growth Tech and AI Companies
Or build your own from over 50 metrics.
Have feedback on this article? Concerned about the content? Get in touch with us directly. Alternatively, email editorial-team@simplywallst.com
About ASX:OEL
Otto Energy
Operates as an oil and gas exploration, production, and sales company in North America.
Flawless balance sheet and slightly overvalued.
Similar Companies
Market Insights

Community Narratives


