- Australia
- /
- Capital Markets
- /
- ASX:HUB
Investing in HUB24 (ASX:HUB) five years ago would have delivered you a 362% gain


We think all investors should try to buy and hold high quality multi-year winners. And highest quality companies can see their share prices grow by huge amounts. To wit, the HUB24 Limited (ASX:HUB) share price has soared 345% over five years. If that doesn't get you thinking about long term investing, we don't know what will. It's also good to see the share price up 25% over the last quarter. This could be related to the recent financial results, released recently - you can catch up on the most recent data by reading our company report.
Let's take a look at the underlying fundamentals over the longer term, and see if they've been consistent with shareholders returns.
View our latest analysis for HUB24
While the efficient markets hypothesis continues to be taught by some, it has been proven that markets are over-reactive dynamic systems, and investors are not always rational. One way to examine how market sentiment has changed over time is to look at the interaction between a company's share price and its earnings per share (EPS).
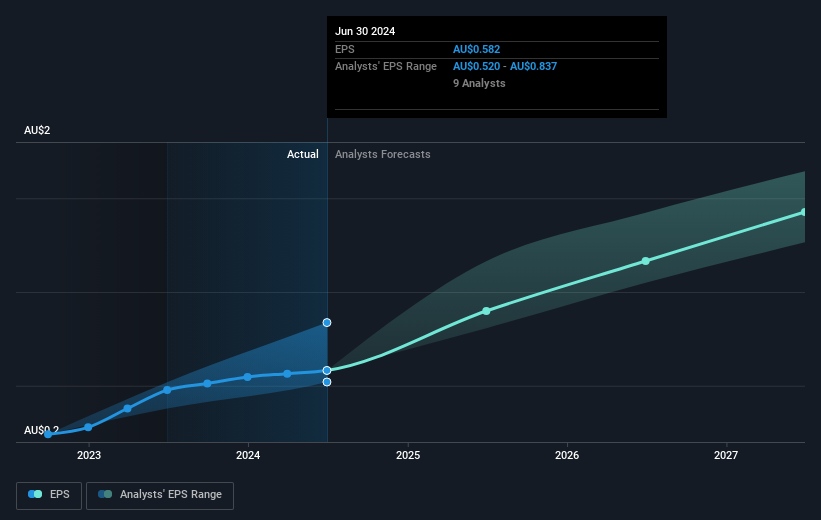
Over half a decade, HUB24 managed to grow its earnings per share at 38% a year. This EPS growth is reasonably close to the 35% average annual increase in the share price. This indicates that investor sentiment towards the company has not changed a great deal. Indeed, it would appear the share price is reacting to the EPS.
You can see how EPS has changed over time in the image below (click on the chart to see the exact values).
It is of course excellent to see how HUB24 has grown profits over the years, but the future is more important for shareholders. This free interactive report on HUB24's balance sheet strength is a great place to start, if you want to investigate the stock further.
What About Dividends?
When looking at investment returns, it is important to consider the difference between total shareholder return (TSR) and share price return. The TSR is a return calculation that accounts for the value of cash dividends (assuming that any dividend received was reinvested) and the calculated value of any discounted capital raisings and spin-offs. Arguably, the TSR gives a more comprehensive picture of the return generated by a stock. We note that for HUB24 the TSR over the last 5 years was 362%, which is better than the share price return mentioned above. The dividends paid by the company have thusly boosted the total shareholder return.
A Different Perspective
We're pleased to report that HUB24 shareholders have received a total shareholder return of 70% over one year. That's including the dividend. That gain is better than the annual TSR over five years, which is 36%. Therefore it seems like sentiment around the company has been positive lately. Given the share price momentum remains strong, it might be worth taking a closer look at the stock, lest you miss an opportunity. It's always interesting to track share price performance over the longer term. But to understand HUB24 better, we need to consider many other factors. For instance, we've identified 1 warning sign for HUB24 that you should be aware of.
If you would prefer to check out another company -- one with potentially superior financials -- then do not miss this free list of companies that have proven they can grow earnings.
Please note, the market returns quoted in this article reflect the market weighted average returns of stocks that currently trade on Australian exchanges.
Valuation is complex, but we're here to simplify it.
Discover if HUB24 might be undervalued or overvalued with our detailed analysis, featuring fair value estimates, potential risks, dividends, insider trades, and its financial condition.
Access Free AnalysisHave feedback on this article? Concerned about the content? Get in touch with us directly. Alternatively, email editorial-team (at) simplywallst.com.
This article by Simply Wall St is general in nature. We provide commentary based on historical data and analyst forecasts only using an unbiased methodology and our articles are not intended to be financial advice. It does not constitute a recommendation to buy or sell any stock, and does not take account of your objectives, or your financial situation. We aim to bring you long-term focused analysis driven by fundamental data. Note that our analysis may not factor in the latest price-sensitive company announcements or qualitative material. Simply Wall St has no position in any stocks mentioned.
About ASX:HUB
HUB24
A financial services company, provides integrated platform, technology, and data solutions to wealth industry in Australia.
High growth potential with proven track record.
