- Australia
- /
- Diversified Financial
- /
- ASX:AMP
Reflecting on AMP's (ASX:AMP) Share Price Returns Over The Last Five Years

AMP Limited (ASX:AMP) shareholders should be happy to see the share price up 12% in the last month. But that can't change the reality that over the longer term (five years), the returns have been really quite dismal. Indeed, the share price is down 71% in the period. So we're not so sure if the recent bounce should be celebrated. Of course, this could be the start of a turnaround.
View our latest analysis for AMP
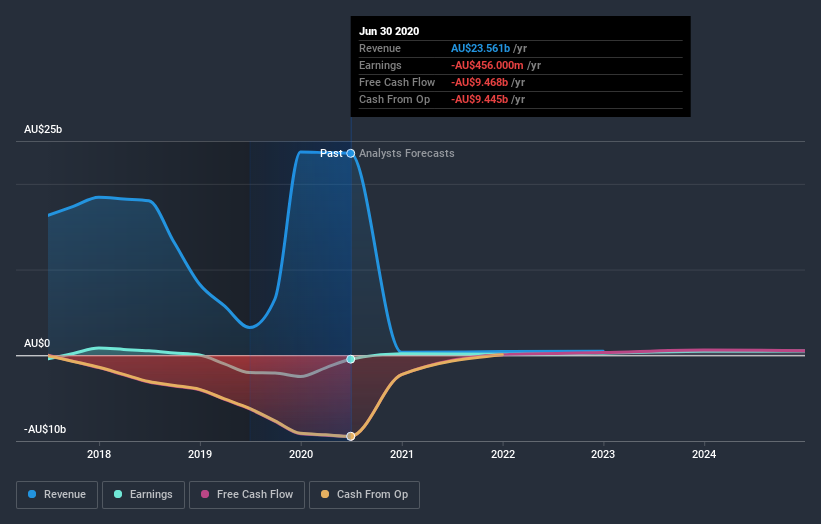
Given that AMP didn't make a profit in the last twelve months, we'll focus on revenue growth to form a quick view of its business development. Generally speaking, companies without profits are expected to grow revenue every year, and at a good clip. As you can imagine, fast revenue growth, when maintained, often leads to fast profit growth.
In the last half decade, AMP saw its revenue increase by 1.0% per year. That's far from impressive given all the money it is losing. Nonetheless, it's fair to say the rapidly declining share price (down 11%, compound, over five years) suggests the market is very disappointed with this level of growth. While we're definitely wary of the stock, after that kind of performance, it could be an over-reaction. A company like this generally needs to produce profits before it can find favour with new investors.
The image below shows how earnings and revenue have tracked over time (if you click on the image you can see greater detail).

We consider it positive that insiders have made significant purchases in the last year. Even so, future earnings will be far more important to whether current shareholders make money. If you are thinking of buying or selling AMP stock, you should check out this free report showing analyst profit forecasts.
What about the Total Shareholder Return (TSR)?
Investors should note that there's a difference between AMP's total shareholder return (TSR) and its share price change, which we've covered above. The TSR attempts to capture the value of dividends (as if they were reinvested) as well as any spin-offs or discounted capital raisings offered to shareholders. Dividends have been really beneficial for AMP shareholders, and that cash payout explains why its total shareholder loss of 62%, over the last 5 years, isn't as bad as the share price return.
A Different Perspective
While the broader market gained around 1.7% in the last year, AMP shareholders lost 6.4%. Even the share prices of good stocks drop sometimes, but we want to see improvements in the fundamental metrics of a business, before getting too interested. Unfortunately, longer term shareholders are suffering worse, given the loss of 10% doled out over the last five years. We would want clear information suggesting the company will grow, before taking the view that the share price will stabilize. It's always interesting to track share price performance over the longer term. But to understand AMP better, we need to consider many other factors. To that end, you should learn about the 2 warning signs we've spotted with AMP (including 1 which is is potentially serious) .
If you like to buy stocks alongside management, then you might just love this free list of companies. (Hint: insiders have been buying them).
Please note, the market returns quoted in this article reflect the market weighted average returns of stocks that currently trade on AU exchanges.
When trading AMP or any other investment, use the platform considered by many to be the Professional's Gateway to the Worlds Market, Interactive Brokers. You get the lowest-cost* trading on stocks, options, futures, forex, bonds and funds worldwide from a single integrated account. Promoted
New: Manage All Your Stock Portfolios in One Place
We've created the ultimate portfolio companion for stock investors, and it's free.
• Connect an unlimited number of Portfolios and see your total in one currency
• Be alerted to new Warning Signs or Risks via email or mobile
• Track the Fair Value of your stocks
This article by Simply Wall St is general in nature. It does not constitute a recommendation to buy or sell any stock, and does not take account of your objectives, or your financial situation. We aim to bring you long-term focused analysis driven by fundamental data. Note that our analysis may not factor in the latest price-sensitive company announcements or qualitative material. Simply Wall St has no position in any stocks mentioned.
*Interactive Brokers Rated Lowest Cost Broker by StockBrokers.com Annual Online Review 2020
Have feedback on this article? Concerned about the content? Get in touch with us directly. Alternatively, email editorial-team@simplywallst.com.
About ASX:AMP
AMP
Provides banking, super, retirement, and advice services in Australia and New Zealand.
Moderate growth potential with questionable track record.


