- Australia
- /
- Commercial Services
- /
- ASX:MAD
Is Mader Group Limited's (ASX:MAD) Recent Stock Performance Tethered To Its Strong Fundamentals?


Most readers would already be aware that Mader Group's (ASX:MAD) stock increased significantly by 8.4% over the past week. Given the company's impressive performance, we decided to study its financial indicators more closely as a company's financial health over the long-term usually dictates market outcomes. Specifically, we decided to study Mader Group's ROE in this article.
ROE or return on equity is a useful tool to assess how effectively a company can generate returns on the investment it received from its shareholders. In short, ROE shows the profit each dollar generates with respect to its shareholder investments.
See our latest analysis for Mader Group
How To Calculate Return On Equity?
Return on equity can be calculated by using the formula:
Return on Equity = Net Profit (from continuing operations) ÷ Shareholders' Equity
So, based on the above formula, the ROE for Mader Group is:
33% = AU$45m ÷ AU$138m (Based on the trailing twelve months to December 2023).
The 'return' is the income the business earned over the last year. One way to conceptualize this is that for each A$1 of shareholders' capital it has, the company made A$0.33 in profit.
What Is The Relationship Between ROE And Earnings Growth?
We have already established that ROE serves as an efficient profit-generating gauge for a company's future earnings. We now need to evaluate how much profit the company reinvests or "retains" for future growth which then gives us an idea about the growth potential of the company. Assuming everything else remains unchanged, the higher the ROE and profit retention, the higher the growth rate of a company compared to companies that don't necessarily bear these characteristics.
A Side By Side comparison of Mader Group's Earnings Growth And 33% ROE
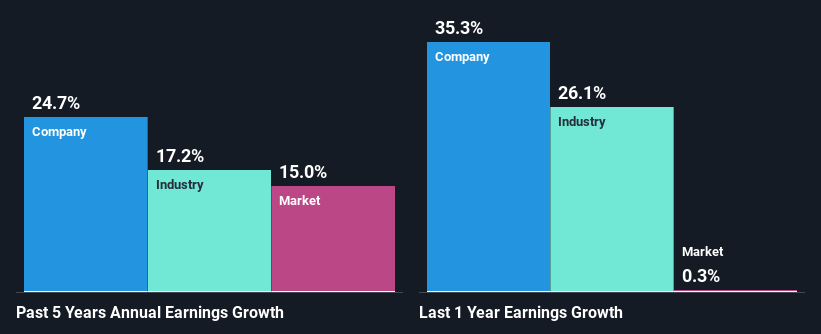
First thing first, we like that Mader Group has an impressive ROE. Secondly, even when compared to the industry average of 12% the company's ROE is quite impressive. Under the circumstances, Mader Group's considerable five year net income growth of 25% was to be expected.
We then compared Mader Group's net income growth with the industry and we're pleased to see that the company's growth figure is higher when compared with the industry which has a growth rate of 17% in the same 5-year period.
The basis for attaching value to a company is, to a great extent, tied to its earnings growth. The investor should try to establish if the expected growth or decline in earnings, whichever the case may be, is priced in. This then helps them determine if the stock is placed for a bright or bleak future. Is Mader Group fairly valued compared to other companies? These 3 valuation measures might help you decide.
Is Mader Group Using Its Retained Earnings Effectively?
The three-year median payout ratio for Mader Group is 31%, which is moderately low. The company is retaining the remaining 69%. This suggests that its dividend is well covered, and given the high growth we discussed above, it looks like Mader Group is reinvesting its earnings efficiently.
Additionally, Mader Group has paid dividends over a period of four years which means that the company is pretty serious about sharing its profits with shareholders. Based on the latest analysts' estimates, we found that the company's future payout ratio over the next three years is expected to hold steady at 35%. Accordingly, forecasts suggest that Mader Group's future ROE will be 30% which is again, similar to the current ROE.
Conclusion
Overall, we are quite pleased with Mader Group's performance. Particularly, we like that the company is reinvesting heavily into its business, and at a high rate of return. Unsurprisingly, this has led to an impressive earnings growth. Having said that, the company's earnings growth is expected to slow down, as forecasted in the current analyst estimates. Are these analysts expectations based on the broad expectations for the industry, or on the company's fundamentals? Click here to be taken to our analyst's forecasts page for the company.
New: Manage All Your Stock Portfolios in One Place
We've created the ultimate portfolio companion for stock investors, and it's free.
• Connect an unlimited number of Portfolios and see your total in one currency
• Be alerted to new Warning Signs or Risks via email or mobile
• Track the Fair Value of your stocks
Have feedback on this article? Concerned about the content? Get in touch with us directly. Alternatively, email editorial-team (at) simplywallst.com.
This article by Simply Wall St is general in nature. We provide commentary based on historical data and analyst forecasts only using an unbiased methodology and our articles are not intended to be financial advice. It does not constitute a recommendation to buy or sell any stock, and does not take account of your objectives, or your financial situation. We aim to bring you long-term focused analysis driven by fundamental data. Note that our analysis may not factor in the latest price-sensitive company announcements or qualitative material. Simply Wall St has no position in any stocks mentioned.
About ASX:MAD
Mader Group
A contracting company, provides specialist technical services in the mining, energy, and industrial sectors in Australia and internationally.
Outstanding track record with flawless balance sheet.
Similar Companies
Market Insights

Community Narratives


