

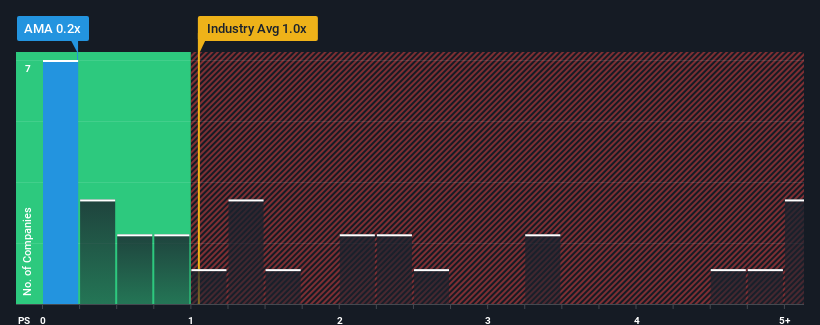
AMA Group Limited's (ASX:AMA) price-to-sales (or "P/S") ratio of 0.2x may look like a pretty appealing investment opportunity when you consider close to half the companies in the Commercial Services industry in Australia have P/S ratios greater than 1.4x. Nonetheless, we'd need to dig a little deeper to determine if there is a rational basis for the reduced P/S.
View our latest analysis for AMA Group
What Does AMA Group's P/S Mean For Shareholders?
With revenue growth that's superior to most other companies of late, AMA Group has been doing relatively well. One possibility is that the P/S ratio is low because investors think this strong revenue performance might be less impressive moving forward. If not, then existing shareholders have reason to be quite optimistic about the future direction of the share price.
If you'd like to see what analysts are forecasting going forward, you should check out our free report on AMA Group.Do Revenue Forecasts Match The Low P/S Ratio?
There's an inherent assumption that a company should underperform the industry for P/S ratios like AMA Group's to be considered reasonable.
Retrospectively, the last year delivered a decent 7.1% gain to the company's revenues. Although, the latest three year period in total hasn't been as good as it didn't manage to provide any growth at all. So it appears to us that the company has had a mixed result in terms of growing revenue over that time.
Turning to the outlook, the next year should generate growth of 6.6% as estimated by the three analysts watching the company. That's shaping up to be materially higher than the 4.1% growth forecast for the broader industry.
In light of this, it's peculiar that AMA Group's P/S sits below the majority of other companies. Apparently some shareholders are doubtful of the forecasts and have been accepting significantly lower selling prices.
The Bottom Line On AMA Group's P/S
Generally, our preference is to limit the use of the price-to-sales ratio to establishing what the market thinks about the overall health of a company.
To us, it seems AMA Group currently trades on a significantly depressed P/S given its forecasted revenue growth is higher than the rest of its industry. The reason for this depressed P/S could potentially be found in the risks the market is pricing in. At least price risks look to be very low, but investors seem to think future revenues could see a lot of volatility.
It is also worth noting that we have found 1 warning sign for AMA Group that you need to take into consideration.
If you're unsure about the strength of AMA Group's business, why not explore our interactive list of stocks with solid business fundamentals for some other companies you may have missed.
New: Manage All Your Stock Portfolios in One Place
We've created the ultimate portfolio companion for stock investors, and it's free.
• Connect an unlimited number of Portfolios and see your total in one currency
• Be alerted to new Warning Signs or Risks via email or mobile
• Track the Fair Value of your stocks
Have feedback on this article? Concerned about the content? Get in touch with us directly. Alternatively, email editorial-team (at) simplywallst.com.
This article by Simply Wall St is general in nature. We provide commentary based on historical data and analyst forecasts only using an unbiased methodology and our articles are not intended to be financial advice. It does not constitute a recommendation to buy or sell any stock, and does not take account of your objectives, or your financial situation. We aim to bring you long-term focused analysis driven by fundamental data. Note that our analysis may not factor in the latest price-sensitive company announcements or qualitative material. Simply Wall St has no position in any stocks mentioned.
About ASX:AMA
AMA Group
Engages in the development and operation of collision repair business in Australia and New Zealand.
Very undervalued with reasonable growth potential.
Similar Companies
Market Insights

Community Narratives
