
Advertisement
- Australia
- /
- Electrical
- /
- ASX:RFT
Market Cool On Rectifier Technologies Limited's (ASX:RFT) Revenues Pushing Shares 42% Lower
Rectifier Technologies Limited (ASX:RFT) shareholders won't be pleased to see that the share price has had a very rough month, dropping 42% and undoing the prior period's positive performance. The recent drop completes a disastrous twelve months for shareholders, who are sitting on a 79% loss during that time.
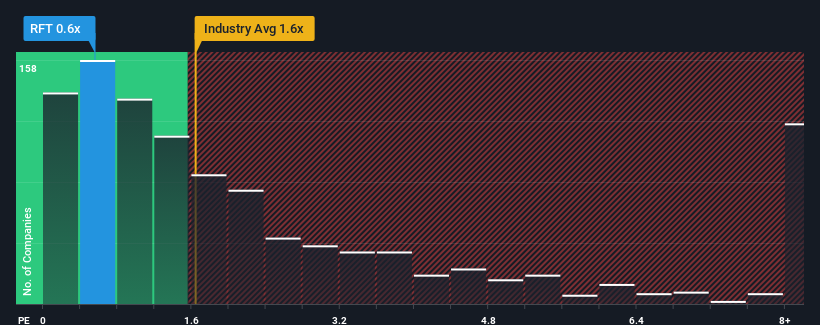
In spite of the heavy fall in price, you could still be forgiven for feeling indifferent about Rectifier Technologies' P/S ratio of 0.6x, since the median price-to-sales (or "P/S") ratio for the Electrical industry in Australia is also close to 0.9x. Although, it's not wise to simply ignore the P/S without explanation as investors may be disregarding a distinct opportunity or a costly mistake.
View our latest analysis for Rectifier Technologies
How Rectifier Technologies Has Been Performing
We'd have to say that with no tangible growth over the last year, Rectifier Technologies' revenue has been unimpressive. Perhaps the market believes the recent run-of-the-mill revenue performance isn't enough to outperform the industry, which has kept the P/S muted. If you like the company, you'd be hoping this isn't the case so that you could potentially pick up some stock while it's not quite in favour.
Want the full picture on earnings, revenue and cash flow for the company? Then our free report on Rectifier Technologies will help you shine a light on its historical performance.How Is Rectifier Technologies' Revenue Growth Trending?
In order to justify its P/S ratio, Rectifier Technologies would need to produce growth that's similar to the industry.
If we review the last year of revenue, the company posted a result that saw barely any deviation from a year ago. Still, the latest three year period has seen an excellent 132% overall rise in revenue, in spite of its uninspiring short-term performance. Accordingly, shareholders will be pleased, but also have some questions to ponder about the last 12 months.
Comparing that recent medium-term revenue trajectory with the industry's one-year growth forecast of 15% shows it's noticeably more attractive.
In light of this, it's curious that Rectifier Technologies' P/S sits in line with the majority of other companies. Apparently some shareholders believe the recent performance is at its limits and have been accepting lower selling prices.
What Does Rectifier Technologies' P/S Mean For Investors?
With its share price dropping off a cliff, the P/S for Rectifier Technologies looks to be in line with the rest of the Electrical industry. Typically, we'd caution against reading too much into price-to-sales ratios when settling on investment decisions, though it can reveal plenty about what other market participants think about the company.
We've established that Rectifier Technologies currently trades on a lower than expected P/S since its recent three-year growth is higher than the wider industry forecast. When we see strong revenue with faster-than-industry growth, we can only assume potential risks are what might be placing pressure on the P/S ratio. At least the risk of a price drop looks to be subdued if recent medium-term revenue trends continue, but investors seem to think future revenue could see some volatility.
And what about other risks? Every company has them, and we've spotted 4 warning signs for Rectifier Technologies (of which 3 are a bit concerning!) you should know about.
It's important to make sure you look for a great company, not just the first idea you come across. So if growing profitability aligns with your idea of a great company, take a peek at this free list of interesting companies with strong recent earnings growth (and a low P/E).
New: AI Stock Screener & Alerts
Our new AI Stock Screener scans the market every day to uncover opportunities.
• Dividend Powerhouses (3%+ Yield)
• Undervalued Small Caps with Insider Buying
• High growth Tech and AI Companies
Or build your own from over 50 metrics.
Have feedback on this article? Concerned about the content? Get in touch with us directly. Alternatively, email editorial-team (at) simplywallst.com.
This article by Simply Wall St is general in nature. We provide commentary based on historical data and analyst forecasts only using an unbiased methodology and our articles are not intended to be financial advice. It does not constitute a recommendation to buy or sell any stock, and does not take account of your objectives, or your financial situation. We aim to bring you long-term focused analysis driven by fundamental data. Note that our analysis may not factor in the latest price-sensitive company announcements or qualitative material. Simply Wall St has no position in any stocks mentioned.
About ASX:RFT
Rectifier Technologies
Designs and manufactures power rectifiers in Australia, Asia, North America, South America, Europe, and Oceania.
Adequate balance sheet and slightly overvalued.
Market Insights


Advertisement
Community Narratives
America Wants Homegrown Drones — Draganfly Is Ready to Deliver
Fair Value US$9.21|27.4% undervalued
JO
Community Contributor
Cheesecake Factory offers an enticing opportunity for long-term growth by leveraging new concepts
Fair Value US$73.83|25.8% undervalued
ZW
Community Contributor
Coca-Cola’s Intrinsic Value Set to Rise with Fed Rate Cut
Fair Value US$67.50|2.7% undervalued
AL
Community Contributor
Fully Permitted Gold Mine with 50 Baggers Potential 
Fair Value CA$41.00|98.0% undervalued
RO
Community Contributor