
Advertisement
- Australia
- /
- Construction
- /
- ASX:JLG
Johns Lyng Group Limited (ASX:JLG) Stocks Pounded By 26% But Not Lagging Market On Growth Or Pricing
To the annoyance of some shareholders, Johns Lyng Group Limited (ASX:JLG) shares are down a considerable 26% in the last month, which continues a horrid run for the company. For any long-term shareholders, the last month ends a year to forget by locking in a 66% share price decline.
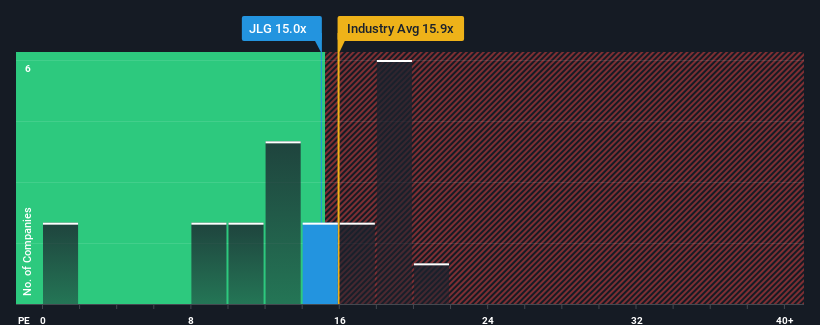
In spite of the heavy fall in price, you could still be forgiven for feeling indifferent about Johns Lyng Group's P/E ratio of 15x, since the median price-to-earnings (or "P/E") ratio in Australia is also close to 17x. Although, it's not wise to simply ignore the P/E without explanation as investors may be disregarding a distinct opportunity or a costly mistake.
Johns Lyng Group hasn't been tracking well recently as its declining earnings compare poorly to other companies, which have seen some growth on average. One possibility is that the P/E is moderate because investors think this poor earnings performance will turn around. You'd really hope so, otherwise you're paying a relatively elevated price for a company with this sort of growth profile.
Check out our latest analysis for Johns Lyng Group
How Is Johns Lyng Group's Growth Trending?
The only time you'd be comfortable seeing a P/E like Johns Lyng Group's is when the company's growth is tracking the market closely.
Retrospectively, the last year delivered a frustrating 16% decrease to the company's bottom line. However, a few very strong years before that means that it was still able to grow EPS by an impressive 51% in total over the last three years. Although it's been a bumpy ride, it's still fair to say the earnings growth recently has been more than adequate for the company.
Shifting to the future, estimates from the eleven analysts covering the company suggest earnings should grow by 17% per annum over the next three years. Meanwhile, the rest of the market is forecast to expand by 15% per annum, which is not materially different.
In light of this, it's understandable that Johns Lyng Group's P/E sits in line with the majority of other companies. It seems most investors are expecting to see average future growth and are only willing to pay a moderate amount for the stock.
The Final Word
Following Johns Lyng Group's share price tumble, its P/E is now hanging on to the median market P/E. While the price-to-earnings ratio shouldn't be the defining factor in whether you buy a stock or not, it's quite a capable barometer of earnings expectations.
As we suspected, our examination of Johns Lyng Group's analyst forecasts revealed that its market-matching earnings outlook is contributing to its current P/E. At this stage investors feel the potential for an improvement or deterioration in earnings isn't great enough to justify a high or low P/E ratio. It's hard to see the share price moving strongly in either direction in the near future under these circumstances.
You always need to take note of risks, for example - Johns Lyng Group has 2 warning signs we think you should be aware of.
Of course, you might also be able to find a better stock than Johns Lyng Group. So you may wish to see this free collection of other companies that have reasonable P/E ratios and have grown earnings strongly.
New: Manage All Your Stock Portfolios in One Place
We've created the ultimate portfolio companion for stock investors, and it's free.
• Connect an unlimited number of Portfolios and see your total in one currency
• Be alerted to new Warning Signs or Risks via email or mobile
• Track the Fair Value of your stocks
Have feedback on this article? Concerned about the content? Get in touch with us directly. Alternatively, email editorial-team (at) simplywallst.com.
This article by Simply Wall St is general in nature. We provide commentary based on historical data and analyst forecasts only using an unbiased methodology and our articles are not intended to be financial advice. It does not constitute a recommendation to buy or sell any stock, and does not take account of your objectives, or your financial situation. We aim to bring you long-term focused analysis driven by fundamental data. Note that our analysis may not factor in the latest price-sensitive company announcements or qualitative material. Simply Wall St has no position in any stocks mentioned.
About ASX:JLG
Johns Lyng Group
Provides integrated building services in Australia, New Zealand, and the United States.
Excellent balance sheet and slightly overvalued.
Similar Companies
Market Insights

Advertisement
Community Narratives
The company that turned a verb into a global necessity and basically runs the modern internet, digital ads, smartphones, maps, and AI.
Fair Value US$300.00|6.3% undervalued
OS
Community Contributor
Flowers Foods Pays A Fair Price For Health
Fair Value US$16.12|26.0% undervalued
NV
Community Contributor
TMX Group will thrive with 33.3% profit margin and enduring market moat
Fair Value CA$49.90|3.7% overvalued
LI
Community Contributor