

Howard Marks put it nicely when he said that, rather than worrying about share price volatility, 'The possibility of permanent loss is the risk I worry about... and every practical investor I know worries about.' It's only natural to consider a company's balance sheet when you examine how risky it is, since debt is often involved when a business collapses. Importantly, FBR Limited (ASX:FBR) does carry debt. But the real question is whether this debt is making the company risky.
When Is Debt Dangerous?
Generally speaking, debt only becomes a real problem when a company can't easily pay it off, either by raising capital or with its own cash flow. If things get really bad, the lenders can take control of the business. However, a more frequent (but still costly) occurrence is where a company must issue shares at bargain-basement prices, permanently diluting shareholders, just to shore up its balance sheet. Of course, the upside of debt is that it often represents cheap capital, especially when it replaces dilution in a company with the ability to reinvest at high rates of return. When we examine debt levels, we first consider both cash and debt levels, together.
See our latest analysis for FBR
What Is FBR's Debt?
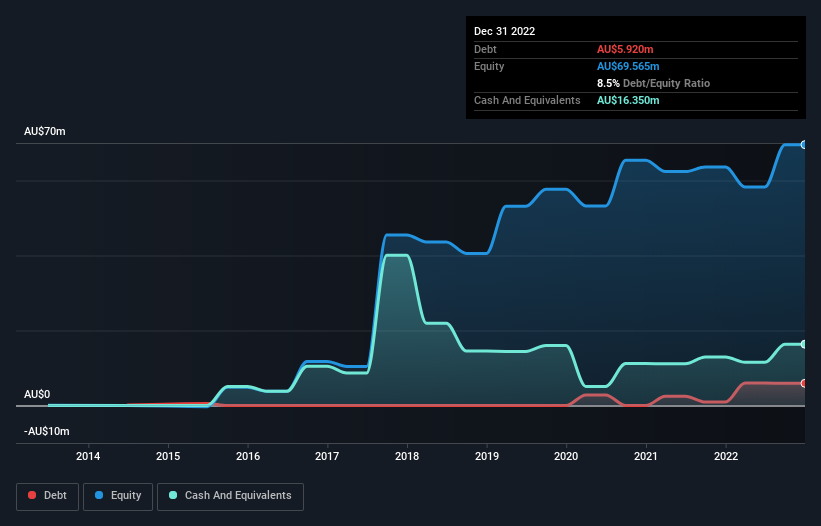
You can click the graphic below for the historical numbers, but it shows that as of December 2022 FBR had AU$5.92m of debt, an increase on AU$902.7k, over one year. However, its balance sheet shows it holds AU$16.4m in cash, so it actually has AU$10.4m net cash.
How Strong Is FBR's Balance Sheet?
The latest balance sheet data shows that FBR had liabilities of AU$11.0m due within a year, and liabilities of AU$3.10m falling due after that. Offsetting this, it had AU$16.4m in cash and AU$9.51m in receivables that were due within 12 months. So it actually has AU$11.8m more liquid assets than total liabilities.
This surplus suggests that FBR has a conservative balance sheet, and could probably eliminate its debt without much difficulty. Simply put, the fact that FBR has more cash than debt is arguably a good indication that it can manage its debt safely. There's no doubt that we learn most about debt from the balance sheet. But it is FBR's earnings that will influence how the balance sheet holds up in the future. So if you're keen to discover more about its earnings, it might be worth checking out this graph of its long term earnings trend.
In the last year FBR wasn't profitable at an EBIT level, but managed to grow its revenue by 39%, to AU$882k. Shareholders probably have their fingers crossed that it can grow its way to profits.
So How Risky Is FBR?
Statistically speaking companies that lose money are riskier than those that make money. And we do note that FBR had an earnings before interest and tax (EBIT) loss, over the last year. And over the same period it saw negative free cash outflow of AU$29m and booked a AU$24m accounting loss. Given it only has net cash of AU$10.4m, the company may need to raise more capital if it doesn't reach break-even soon. FBR's revenue growth shone bright over the last year, so it may well be in a position to turn a profit in due course. Pre-profit companies are often risky, but they can also offer great rewards. When analysing debt levels, the balance sheet is the obvious place to start. However, not all investment risk resides within the balance sheet - far from it. Be aware that FBR is showing 5 warning signs in our investment analysis , and 3 of those are significant...
If, after all that, you're more interested in a fast growing company with a rock-solid balance sheet, then check out our list of net cash growth stocks without delay.
If you're looking to trade FBR, open an account with the lowest-cost platform trusted by professionals, Interactive Brokers.
With clients in over 200 countries and territories, and access to 160 markets, IBKR lets you trade stocks, options, futures, forex, bonds and funds from a single integrated account.
Enjoy no hidden fees, no account minimums, and FX conversion rates as low as 0.03%, far better than what most brokers offer.
Sponsored ContentNew: AI Stock Screener & Alerts
Our new AI Stock Screener scans the market every day to uncover opportunities.
• Dividend Powerhouses (3%+ Yield)
• Undervalued Small Caps with Insider Buying
• High growth Tech and AI Companies
Or build your own from over 50 metrics.
Have feedback on this article? Concerned about the content? Get in touch with us directly. Alternatively, email editorial-team (at) simplywallst.com.
This article by Simply Wall St is general in nature. We provide commentary based on historical data and analyst forecasts only using an unbiased methodology and our articles are not intended to be financial advice. It does not constitute a recommendation to buy or sell any stock, and does not take account of your objectives, or your financial situation. We aim to bring you long-term focused analysis driven by fundamental data. Note that our analysis may not factor in the latest price-sensitive company announcements or qualitative material. Simply Wall St has no position in any stocks mentioned.
About ASX:FBR
Excellent balance sheet moderate.
Market Insights

Community Narratives

