
Advertisement
An Intrinsic Calculation For The Environmental Group Limited (ASX:EGL) Suggests It's 43% Undervalued
Key Insights
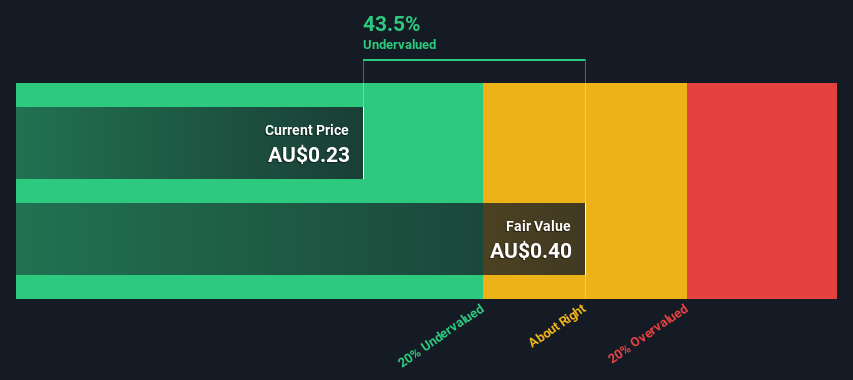
- Environmental Group's estimated fair value is AU$0.40 based on 2 Stage Free Cash Flow to Equity
- Environmental Group's AU$0.23 share price signals that it might be 43% undervalued
Does the October share price for The Environmental Group Limited (ASX:EGL) reflect what it's really worth? Today, we will estimate the stock's intrinsic value by taking the forecast future cash flows of the company and discounting them back to today's value. One way to achieve this is by employing the Discounted Cash Flow (DCF) model. It may sound complicated, but actually it is quite simple!
Companies can be valued in a lot of ways, so we would point out that a DCF is not perfect for every situation. For those who are keen learners of equity analysis, the Simply Wall St analysis model here may be something of interest to you.
Check out our latest analysis for Environmental Group
The Method
We are going to use a two-stage DCF model, which, as the name states, takes into account two stages of growth. The first stage is generally a higher growth period which levels off heading towards the terminal value, captured in the second 'steady growth' period. To start off with, we need to estimate the next ten years of cash flows. Where possible we use analyst estimates, but when these aren't available we extrapolate the previous free cash flow (FCF) from the last estimate or reported value. We assume companies with shrinking free cash flow will slow their rate of shrinkage, and that companies with growing free cash flow will see their growth rate slow, over this period. We do this to reflect that growth tends to slow more in the early years than it does in later years.
A DCF is all about the idea that a dollar in the future is less valuable than a dollar today, so we need to discount the sum of these future cash flows to arrive at a present value estimate:
10-year free cash flow (FCF) estimate
| 2024 | 2025 | 2026 | 2027 | 2028 | 2029 | 2030 | 2031 | 2032 | 2033 | |
| Levered FCF (A$, Millions) | AU$3.40m | AU$5.70m | AU$6.60m | AU$7.26m | AU$7.82m | AU$8.28m | AU$8.67m | AU$9.02m | AU$9.32m | AU$9.59m |
| Growth Rate Estimate Source | Analyst x1 | Analyst x1 | Analyst x1 | Est @ 10.03% | Est @ 7.63% | Est @ 5.94% | Est @ 4.76% | Est @ 3.94% | Est @ 3.36% | Est @ 2.95% |
| Present Value (A$, Millions) Discounted @ 7.1% | AU$3.2 | AU$5.0 | AU$5.4 | AU$5.5 | AU$5.5 | AU$5.5 | AU$5.3 | AU$5.2 | AU$5.0 | AU$4.8 |
("Est" = FCF growth rate estimated by Simply Wall St)
Present Value of 10-year Cash Flow (PVCF) = AU$50m
The second stage is also known as Terminal Value, this is the business's cash flow after the first stage. For a number of reasons a very conservative growth rate is used that cannot exceed that of a country's GDP growth. In this case we have used the 5-year average of the 10-year government bond yield (2.0%) to estimate future growth. In the same way as with the 10-year 'growth' period, we discount future cash flows to today's value, using a cost of equity of 7.1%.
Terminal Value (TV)= FCF2033 × (1 + g) ÷ (r – g) = AU$9.6m× (1 + 2.0%) ÷ (7.1%– 2.0%) = AU$190m
Present Value of Terminal Value (PVTV)= TV / (1 + r)10= AU$190m÷ ( 1 + 7.1%)10= AU$95m
The total value is the sum of cash flows for the next ten years plus the discounted terminal value, which results in the Total Equity Value, which in this case is AU$146m. In the final step we divide the equity value by the number of shares outstanding. Relative to the current share price of AU$0.2, the company appears quite good value at a 43% discount to where the stock price trades currently. The assumptions in any calculation have a big impact on the valuation, so it is better to view this as a rough estimate, not precise down to the last cent.
Important Assumptions
We would point out that the most important inputs to a discounted cash flow are the discount rate and of course the actual cash flows. If you don't agree with these result, have a go at the calculation yourself and play with the assumptions. The DCF also does not consider the possible cyclicality of an industry, or a company's future capital requirements, so it does not give a full picture of a company's potential performance. Given that we are looking at Environmental Group as potential shareholders, the cost of equity is used as the discount rate, rather than the cost of capital (or weighted average cost of capital, WACC) which accounts for debt. In this calculation we've used 7.1%, which is based on a levered beta of 1.028. Beta is a measure of a stock's volatility, compared to the market as a whole. We get our beta from the industry average beta of globally comparable companies, with an imposed limit between 0.8 and 2.0, which is a reasonable range for a stable business.
SWOT Analysis for Environmental Group
Strength
- Earnings growth over the past year exceeded the industry.
- Debt is not viewed as a risk.
Weakness
- Shareholders have been diluted in the past year.
Opportunity
- Annual earnings are forecast to grow faster than the Australian market.
- Trading below our estimate of fair value by more than 20%.
Threat
- No apparent threats visible for EGL.
Next Steps:
Although the valuation of a company is important, it ideally won't be the sole piece of analysis you scrutinize for a company. DCF models are not the be-all and end-all of investment valuation. Rather it should be seen as a guide to "what assumptions need to be true for this stock to be under/overvalued?" For example, changes in the company's cost of equity or the risk free rate can significantly impact the valuation. Can we work out why the company is trading at a discount to intrinsic value? For Environmental Group, we've compiled three important aspects you should explore:
- Risks: Case in point, we've spotted 3 warning signs for Environmental Group you should be aware of.
- Future Earnings: How does EGL's growth rate compare to its peers and the wider market? Dig deeper into the analyst consensus number for the upcoming years by interacting with our free analyst growth expectation chart.
- Other High Quality Alternatives: Do you like a good all-rounder? Explore our interactive list of high quality stocks to get an idea of what else is out there you may be missing!
PS. The Simply Wall St app conducts a discounted cash flow valuation for every stock on the ASX every day. If you want to find the calculation for other stocks just search here.
Valuation is complex, but we're here to simplify it.
Discover if Environmental Group might be undervalued or overvalued with our detailed analysis, featuring fair value estimates, potential risks, dividends, insider trades, and its financial condition.
Access Free AnalysisHave feedback on this article? Concerned about the content? Get in touch with us directly. Alternatively, email editorial-team (at) simplywallst.com.
This article by Simply Wall St is general in nature. We provide commentary based on historical data and analyst forecasts only using an unbiased methodology and our articles are not intended to be financial advice. It does not constitute a recommendation to buy or sell any stock, and does not take account of your objectives, or your financial situation. We aim to bring you long-term focused analysis driven by fundamental data. Note that our analysis may not factor in the latest price-sensitive company announcements or qualitative material. Simply Wall St has no position in any stocks mentioned.
About ASX:EGL
Environmental Group
Engages in the design, application, and servicing of gas, vapor and dust emission control systems, and inlet and exhaust systems for gas turbines in Australia and internationally.
Undervalued with excellent balance sheet.
Market Insights


Advertisement
Community Narratives
America Wants Homegrown Drones — Draganfly Is Ready to Deliver
Fair Value US$9.21|27.4% undervalued
JO
Community Contributor
Cheesecake Factory offers an enticing opportunity for long-term growth by leveraging new concepts
Fair Value US$73.83|25.8% undervalued
ZW
Community Contributor
Coca-Cola’s Intrinsic Value Set to Rise with Fed Rate Cut
Fair Value US$67.50|2.7% undervalued
AL
Community Contributor
Fully Permitted Gold Mine with 50 Baggers Potential 
Fair Value CA$41.00|98.0% undervalued
RO
Community Contributor