- Australia
- /
- Construction
- /
- ASX:AE1
Aerison Group's (ASX:AE1) Returns On Capital Not Reflecting Well On The Business


What are the early trends we should look for to identify a stock that could multiply in value over the long term? Amongst other things, we'll want to see two things; firstly, a growing return on capital employed (ROCE) and secondly, an expansion in the company's amount of capital employed. Ultimately, this demonstrates that it's a business that is reinvesting profits at increasing rates of return. Looking at Aerison Group (ASX:AE1), it does have a high ROCE right now, but lets see how returns are trending.
What Is Return On Capital Employed (ROCE)?
If you haven't worked with ROCE before, it measures the 'return' (pre-tax profit) a company generates from capital employed in its business. The formula for this calculation on Aerison Group is:
Return on Capital Employed = Earnings Before Interest and Tax (EBIT) ÷ (Total Assets - Current Liabilities)
0.24 = AU$9.9m ÷ (AU$102m - AU$61m) (Based on the trailing twelve months to June 2022).
So, Aerison Group has an ROCE of 24%. That's a fantastic return and not only that, it outpaces the average of 14% earned by companies in a similar industry.
Check out the opportunities and risks within the AU Construction industry.
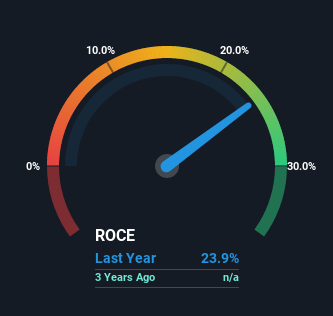
Historical performance is a great place to start when researching a stock so above you can see the gauge for Aerison Group's ROCE against it's prior returns. If you're interested in investigating Aerison Group's past further, check out this free graph of past earnings, revenue and cash flow.
What Does the ROCE Trend For Aerison Group Tell Us?
On the surface, the trend of ROCE at Aerison Group doesn't inspire confidence. Historically returns on capital were even higher at 46%, but they have dropped over the last two years. Although, given both revenue and the amount of assets employed in the business have increased, it could suggest the company is investing in growth, and the extra capital has led to a short-term reduction in ROCE. And if the increased capital generates additional returns, the business, and thus shareholders, will benefit in the long run.
On a side note, Aerison Group's current liabilities are still rather high at 60% of total assets. This can bring about some risks because the company is basically operating with a rather large reliance on its suppliers or other sorts of short-term creditors. Ideally we'd like to see this reduce as that would mean fewer obligations bearing risks.
What We Can Learn From Aerison Group's ROCE
Even though returns on capital have fallen in the short term, we find it promising that revenue and capital employed have both increased for Aerison Group. However, total returns to shareholders over the last year have been flat, which could indicate these growth trends potentially aren't accounted for yet by investors. As a result, we'd recommend researching this stock further to uncover what other fundamentals of the business can show us.
If you want to continue researching Aerison Group, you might be interested to know about the 3 warning signs that our analysis has discovered.
Aerison Group is not the only stock earning high returns. If you'd like to see more, check out our free list of companies earning high returns on equity with solid fundamentals.
If you're looking to trade Aerison Group, open an account with the lowest-cost platform trusted by professionals, Interactive Brokers.
With clients in over 200 countries and territories, and access to 160 markets, IBKR lets you trade stocks, options, futures, forex, bonds and funds from a single integrated account.
Enjoy no hidden fees, no account minimums, and FX conversion rates as low as 0.03%, far better than what most brokers offer.
Sponsored ContentNew: Manage All Your Stock Portfolios in One Place
We've created the ultimate portfolio companion for stock investors, and it's free.
• Connect an unlimited number of Portfolios and see your total in one currency
• Be alerted to new Warning Signs or Risks via email or mobile
• Track the Fair Value of your stocks
Have feedback on this article? Concerned about the content? Get in touch with us directly. Alternatively, email editorial-team (at) simplywallst.com.
This article by Simply Wall St is general in nature. We provide commentary based on historical data and analyst forecasts only using an unbiased methodology and our articles are not intended to be financial advice. It does not constitute a recommendation to buy or sell any stock, and does not take account of your objectives, or your financial situation. We aim to bring you long-term focused analysis driven by fundamental data. Note that our analysis may not factor in the latest price-sensitive company announcements or qualitative material. Simply Wall St has no position in any stocks mentioned.
About ASX:AE1
Aerison Group
Aerison Group Limited operates as an engineering, design, and construction company in Australia.
Good value with mediocre balance sheet.
Market Insights

Community Narratives


