
Advertisement
- United Kingdom
- /
- Hospitality
- /
- LSE:FSTA
How Does Fuller Smith & Turner's (LON:FSTA) P/E Compare To Its Industry, After The Share Price Drop?
To the annoyance of some shareholders, Fuller Smith & Turner (LON:FSTA) shares are down a considerable 30% in the last month. Indeed the recent decline has arguably caused some bitterness for shareholders who have held through the 42% drop over twelve months.
All else being equal, a share price drop should make a stock more attractive to potential investors. In the long term, share prices tend to follow earnings per share, but in the short term prices bounce around in response to short term factors (which are not always obvious). So, on certain occasions, long term focussed investors try to take advantage of pessimistic expectations to buy shares at a better price. Perhaps the simplest way to get a read on investors' expectations of a business is to look at its Price to Earnings Ratio (PE Ratio). A high P/E implies that investors have high expectations of what a company can achieve compared to a company with a low P/E ratio.
Check out our latest analysis for Fuller Smith & Turner
Does Fuller Smith & Turner Have A Relatively High Or Low P/E For Its Industry?
Fuller Smith & Turner's P/E of 28.38 indicates some degree of optimism towards the stock. As you can see below, Fuller Smith & Turner has a higher P/E than the average company (15.3) in the hospitality industry.
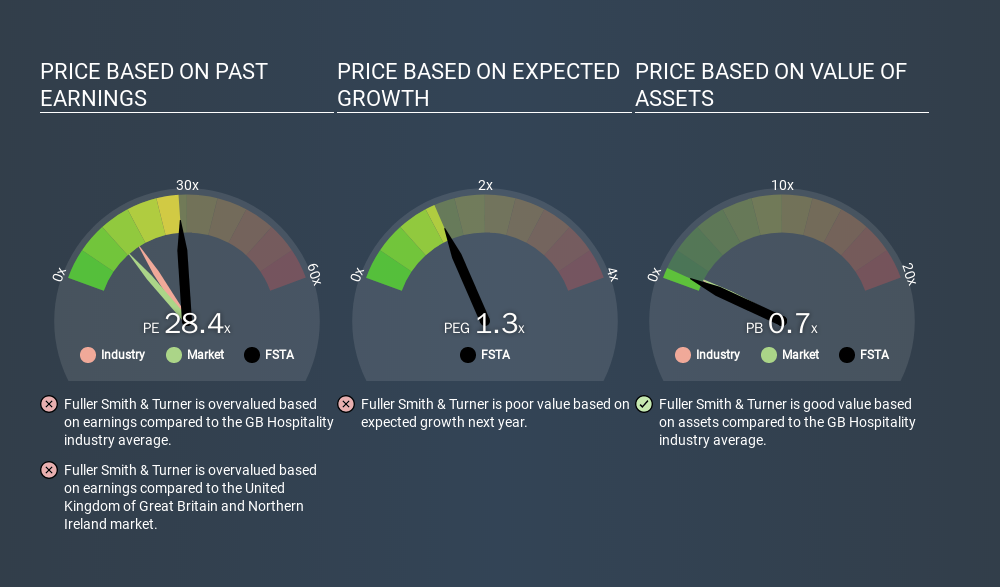
Fuller Smith & Turner's P/E tells us that market participants think the company will perform better than its industry peers, going forward. Shareholders are clearly optimistic, but the future is always uncertain. So further research is always essential. I often monitor director buying and selling.
How Growth Rates Impact P/E Ratios
When earnings fall, the 'E' decreases, over time. That means even if the current P/E is low, it will increase over time if the share price stays flat. A higher P/E should indicate the stock is expensive relative to others -- and that may encourage shareholders to sell.
Fuller Smith & Turner saw earnings per share decrease by 44% last year. And EPS is down 14% a year, over the last 5 years. This growth rate might warrant a below average P/E ratio.
Don't Forget: The P/E Does Not Account For Debt or Bank Deposits
The 'Price' in P/E reflects the market capitalization of the company. Thus, the metric does not reflect cash or debt held by the company. Theoretically, a business can improve its earnings (and produce a lower P/E in the future) by investing in growth. That means taking on debt (or spending its cash).
Spending on growth might be good or bad a few years later, but the point is that the P/E ratio does not account for the option (or lack thereof).
Is Debt Impacting Fuller Smith & Turner's P/E?
Fuller Smith & Turner has net debt worth just 7.0% of its market capitalization. So it doesn't have as many options as it would with net cash, but its debt would not have much of an impact on its P/E ratio.
The Verdict On Fuller Smith & Turner's P/E Ratio
Fuller Smith & Turner's P/E is 28.4 which is above average (11.9) in its market. With a bit of debt, but a lack of recent growth, it's safe to say the market is expecting improved profit performance from the company, in the next few years. What can be absolutely certain is that the market has become significantly less optimistic about Fuller Smith & Turner over the last month, with the P/E ratio falling from 40.6 back then to 28.4 today. For those who don't like to trade against momentum, that could be a warning sign, but a contrarian investor might want to take a closer look.
When the market is wrong about a stock, it gives savvy investors an opportunity. People often underestimate remarkable growth -- so investors can make money when fast growth is not fully appreciated. So this free report on the analyst consensus forecasts could help you make a master move on this stock.
Of course, you might find a fantastic investment by looking at a few good candidates. So take a peek at this free list of companies with modest (or no) debt, trading on a P/E below 20.
If you spot an error that warrants correction, please contact the editor at editorial-team@simplywallst.com. This article by Simply Wall St is general in nature. It does not constitute a recommendation to buy or sell any stock, and does not take account of your objectives, or your financial situation. Simply Wall St has no position in the stocks mentioned.
We aim to bring you long-term focused research analysis driven by fundamental data. Note that our analysis may not factor in the latest price-sensitive company announcements or qualitative material. Thank you for reading.
 mitchell_lawler
The Foxhole
A dozen retail giants report this week, and they won't agree on whether the consumer is healthy. What if that disagreement is the real signal?
88
PowerLaw
I won't rely solely on Retail Sales. It only tell you what was spent. Credit data is the one that tells you how. For me the latter is more important than the former.
About LSE:FSTA
Fuller Smith & Turner
Operates pubs and hotels in the United Kingdom.
Adequate balance sheet average dividend payer.
Similar Companies
Market Insights

Advertisement
Weekly Picks
RI


Rick_Orford on Starfighters Space ·
The 1960s Fighter Jet That Could Crack Open a $20 Billion Satellite Market
Fair Value:US$515.2% undervalued
35 followersusers have followed this narrative
2 commentsusers have commented on this narrative
7 likesusers have liked this narrative
FU


FundamentalFlow on Vertiv Holdings Co ·
The Short and Long Term Compounder of Liquid Cooling industry.
Fair Value:US$45034.7% undervalued
67 followersusers have followed this narrative
0 commentsusers have commented on this narrative
13 likesusers have liked this narrative
JO


John_Eric on SPX Technologies ·
I Fell in Love With a Data-Center Cooling Stock. Then I Opened the Filings.
Fair Value:US$2037.1% overvalued
28 followersusers have followed this narrative
2 commentsusers have commented on this narrative
11 likesusers have liked this narrative
TR


tripledub on GQG Partners ·
The Cheap Genius Problem
Fair Value:AU$3.2154.8% undervalued
36 followersusers have followed this narrative
0 commentsusers have commented on this narrative
24 likesusers have liked this narrative
Recently Updated Narratives
TH

thepacific on Veefin Solutions ·
Undervalued, Underestimated
Fair Value:₹569.3956.2% undervalued
16 followersusers have followed this narrative
1 commentusers have commented on this narrative
0 likesusers have liked this narrative
RO


RockeTeller on Vizsla Silver ·
Vizsla Silver 111% IRR Project: Why Panuco Changes Everything + Security Risk?
Fair Value:CA$69.0392.5% undervalued
11 followersusers have followed this narrative
4 commentsusers have commented on this narrative
1 likeusers have liked this narrative
MO

moataz_5ewrk on Cairo For Investment And Real Estate Developments-CIRA Education ·
Deep Value Opportunity
Fair Value:ج.م43.5711.7% undervalued
1 followerusers have followed this narrative
0 commentsusers have commented on this narrative
0 likesusers have liked this narrative
Popular Narratives
OS


oscargarcia on NVIDIA ·
The company that went from selling GPUs to gamers to becoming the AI arms dealer of the 21st century.
Fair Value:US$28019.6% undervalued
315 followersusers have followed this narrative
9 commentsusers have commented on this narrative
16 likesusers have liked this narrative
CU

CubanEros on Microsoft ·
A wonderful business at reasonable price.
Fair Value:US$419.9118.0% overvalued
172 followersusers have followed this narrative
0 commentsusers have commented on this narrative
8 likesusers have liked this narrative
KI

KiwiInvest on Amazon.com ·
Amazon's high growth, high tech segments propel its profits, while traditional segments plod along
Fair Value:US$475.0944.7% undervalued
195 followersusers have followed this narrative
1 commentusers have commented on this narrative
8 likesusers have liked this narrative
Trending Discussion
JA
james_rxfd8 on Starfighters Space ·
How is this different to Virgin Orbit, which didn’t seem to work out, with a very similar plan?
3
|2
GE

george_b177x on Bloom Energy ·
Brilliant analysis. Great company with proven product and service!
1
|1