Advertisement
- United Kingdom
- /
- Transportation
- /
- LSE:MCG
Despite Its High P/E Ratio, Is National Express Group PLC (LON:NEX) Still Undervalued?
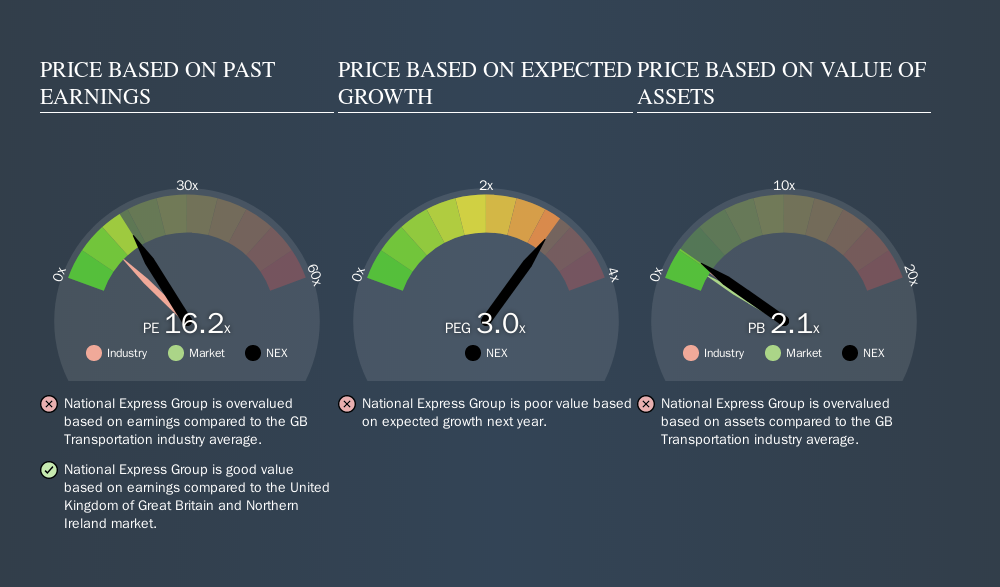
The goal of this article is to teach you how to use price to earnings ratios (P/E ratios). We'll show how you can use National Express Group PLC's (LON:NEX) P/E ratio to inform your assessment of the investment opportunity. Looking at earnings over the last twelve months, National Express Group has a P/E ratio of 16.23. That means that at current prices, buyers pay £16.23 for every £1 in trailing yearly profits.
View our latest analysis for National Express Group
How Do I Calculate A Price To Earnings Ratio?
The formula for price to earnings is:
Price to Earnings Ratio = Share Price ÷ Earnings per Share (EPS)
Or for National Express Group:
P/E of 16.23 = £4.48 ÷ £0.28 (Based on the trailing twelve months to June 2019.)
Is A High Price-to-Earnings Ratio Good?
A higher P/E ratio implies that investors pay a higher price for the earning power of the business. That isn't a good or a bad thing on its own, but a high P/E means that buyers have a higher opinion of the business's prospects, relative to stocks with a lower P/E.
Does National Express Group Have A Relatively High Or Low P/E For Its Industry?
The P/E ratio indicates whether the market has higher or lower expectations of a company. As you can see below, National Express Group has a higher P/E than the average company (10.4) in the transportation industry.
Its relatively high P/E ratio indicates that National Express Group shareholders think it will perform better than other companies in its industry classification. Clearly the market expects growth, but it isn't guaranteed. So further research is always essential. I often monitor director buying and selling.
How Growth Rates Impact P/E Ratios
P/E ratios primarily reflect market expectations around earnings growth rates. That's because companies that grow earnings per share quickly will rapidly increase the 'E' in the equation. Therefore, even if you pay a high multiple of earnings now, that multiple will become lower in the future. So while a stock may look expensive based on past earnings, it could be cheap based on future earnings.
National Express Group increased earnings per share by 2.8% last year. And it has bolstered its earnings per share by 24% per year over the last five years.
Don't Forget: The P/E Does Not Account For Debt or Bank Deposits
It's important to note that the P/E ratio considers the market capitalization, not the enterprise value. That means it doesn't take debt or cash into account. Hypothetically, a company could reduce its future P/E ratio by spending its cash (or taking on debt) to achieve higher earnings.
Spending on growth might be good or bad a few years later, but the point is that the P/E ratio does not account for the option (or lack thereof).
Is Debt Impacting National Express Group's P/E?
National Express Group has net debt worth 50% of its market capitalization. This is enough debt that you'd have to make some adjustments before using the P/E ratio to compare it to a company with net cash.
The Verdict On National Express Group's P/E Ratio
National Express Group has a P/E of 16.2. That's around the same as the average in the GB market, which is 16.6. With meaningful debt and only modest earnings growth, the market seems to be expecting a steady performance going forward.
When the market is wrong about a stock, it gives savvy investors an opportunity. As value investor Benjamin Graham famously said, 'In the short run, the market is a voting machine but in the long run, it is a weighing machine. So this free visualization of the analyst consensus on future earnings could help you make the right decision about whether to buy, sell, or hold.
But note: National Express Group may not be the best stock to buy. So take a peek at this free list of interesting companies with strong recent earnings growth (and a P/E ratio below 20).
We aim to bring you long-term focused research analysis driven by fundamental data. Note that our analysis may not factor in the latest price-sensitive company announcements or qualitative material.
If you spot an error that warrants correction, please contact the editor at editorial-team@simplywallst.com. This article by Simply Wall St is general in nature. It does not constitute a recommendation to buy or sell any stock, and does not take account of your objectives, or your financial situation. Simply Wall St has no position in the stocks mentioned. Thank you for reading.
About LSE:MCG
Mobico Group
Designs, mobilizes, and operates transport services worldwide.
Undervalued with reasonable growth potential.
Similar Companies
Market Insights


Advertisement
Weekly Picks
ST


stuart_roberts on Upside Gold ·
An Undervalued 3.3Moz Gold Project in Canada
Fair Value:CA$5.0775.1% undervalued
130 followersusers have followed this narrative
1 commentusers have commented on this narrative
21 likesusers have liked this narrative
YA

Yang_ on SoFi Technologies ·
SoFi Technologies: The Apex Aggregator and the Infrastructure of the Modern Financial System
Fair Value:US$22.9822.7% undervalued
41 followersusers have followed this narrative
0 commentsusers have commented on this narrative
33 likesusers have liked this narrative
KO

Kouj on CSL ·
CSL: The Dip Is the Opportunity
Fair Value:AU$1559.0% undervalued
18 followersusers have followed this narrative
0 commentsusers have commented on this narrative
13 likesusers have liked this narrative
GA

GavrielH on DHT Holdings ·
DHT Holdings, inc: Strait of Hormuz Risk Amidst US-Israel vs Iran Tensions Spikes VLCC Rates.
Fair Value:US$3653.2% undervalued
15 followersusers have followed this narrative
0 commentsusers have commented on this narrative
9 likesusers have liked this narrative
Recently Updated Narratives
VE

Vestra on MasTec ·
MasTec Inc. (MTZ): The Infrastructure Super-Cycle and the $19 Billion Backlog Milestone
Fair Value:US$33613.7% undervalued
1 followerusers have followed this narrative
0 commentsusers have commented on this narrative
0 likesusers have liked this narrative
SA

Sax on Super Retail Group ·
Fair Value Intriguingly Set at $11.54 for SUL Investors
Fair Value:AU$13.431.4% undervalued
2 followersusers have followed this narrative
0 commentsusers have commented on this narrative
0 likesusers have liked this narrative
VE

Vestra on Dell Technologies ·
Dell Technologies (DELL): The AI Infrastructure Super-Cycle and the $50 Billion Server Milestone
Fair Value:US$193.521.6% undervalued
2 followersusers have followed this narrative
0 commentsusers have commented on this narrative
1 likeusers have liked this narrative
Popular Narratives
KA

kabz2342 on Nu Holdings ·
Nu holdings will continue to disrupt the South American banking market
Fair Value:US$64.378.4% undervalued
53 followersusers have followed this narrative
3 commentsusers have commented on this narrative
29 likesusers have liked this narrative
YA
Yang_ on SoFi Technologies ·
SoFi Technologies: The Apex Aggregator and the Infrastructure of the Modern Financial System
Fair Value:US$22.9822.7% undervalued
41 followersusers have followed this narrative
0 commentsusers have commented on this narrative
33 likesusers have liked this narrative
AN


AnalystConsensusTarget on Microsoft ·
Analyst Commentary Highlights Microsoft AI Momentum and Upward Valuation Amid Growth and Competitive Risks
Fair Value:US$59633.6% undervalued
1308 followersusers have followed this narrative
2 commentsusers have commented on this narrative
10 likesusers have liked this narrative
Trending Discussion


DA

daqui_luis on Corticeira Amorim S.G.P.S ·
Great analysis on a great and solid company with a dominant position in the Cork Market.
1
|0
