- Italy
- /
- Commercial Services
- /
- BIT:FILA
Calculating The Intrinsic Value Of F.I.L.A. - Fabbrica Italiana Lapis ed Affini S.p.A. (BIT:FILA)

How far off is F.I.L.A. - Fabbrica Italiana Lapis ed Affini S.p.A. (BIT:FILA) from its intrinsic value? Using the most recent financial data, we'll take a look at whether the stock is fairly priced by estimating the company's future cash flows and discounting them to their present value. I will use the Discounted Cash Flow (DCF) model. Don't get put off by the jargon, the math behind it is actually quite straightforward.
Companies can be valued in a lot of ways, so we would point out that a DCF is not perfect for every situation. If you want to learn more about discounted cash flow, the rationale behind this calculation can be read in detail in the Simply Wall St analysis model.
View our latest analysis for F.I.L.A. - Fabbrica Italiana Lapis ed Affini
What's the estimated valuation?
We are going to use a two-stage DCF model, which, as the name states, takes into account two stages of growth. The first stage is generally a higher growth period which levels off heading towards the terminal value, captured in the second 'steady growth' period. In the first stage we need to estimate the cash flows to the business over the next ten years. Where possible we use analyst estimates, but when these aren't available we extrapolate the previous free cash flow (FCF) from the last estimate or reported value. We assume companies with shrinking free cash flow will slow their rate of shrinkage, and that companies with growing free cash flow will see their growth rate slow, over this period. We do this to reflect that growth tends to slow more in the early years than it does in later years.
A DCF is all about the idea that a dollar in the future is less valuable than a dollar today, so we need to discount the sum of these future cash flows to arrive at a present value estimate:
10-year free cash flow (FCF) estimate
| 2020 | 2021 | 2022 | 2023 | 2024 | 2025 | 2026 | 2027 | 2028 | 2029 | |
| Levered FCF (€, Millions) | €52.0m | €55.4m | €69.3m | €68.0m | €67.5m | €67.5m | €68.0m | €68.7m | €69.6m | €70.6m |
| Growth Rate Estimate Source | Analyst x3 | Analyst x3 | Analyst x2 | Est @ -1.87% | Est @ -0.72% | Est @ 0.08% | Est @ 0.64% | Est @ 1.03% | Est @ 1.31% | Est @ 1.5% |
| Present Value (€, Millions) Discounted @ 17% | €44.4 | €40.3 | €42.9 | €35.9 | €30.4 | €26.0 | €22.3 | €19.2 | €16.6 | €14.4 |
("Est" = FCF growth rate estimated by Simply Wall St)
Present Value of 10-year Cash Flow (PVCF) = €292m
The second stage is also known as Terminal Value, this is the business's cash flow after the first stage. The Gordon Growth formula is used to calculate Terminal Value at a future annual growth rate equal to the 10-year government bond rate of 2.0%. We discount the terminal cash flows to today's value at a cost of equity of 17%.
Terminal Value (TV)= FCF2029 × (1 + g) ÷ (r – g) = €71m× (1 + 2.0%) ÷ 17%– 2.0%) = €470m
Present Value of Terminal Value (PVTV)= TV / (1 + r)10= €470m÷ ( 1 + 17%)10= €96m
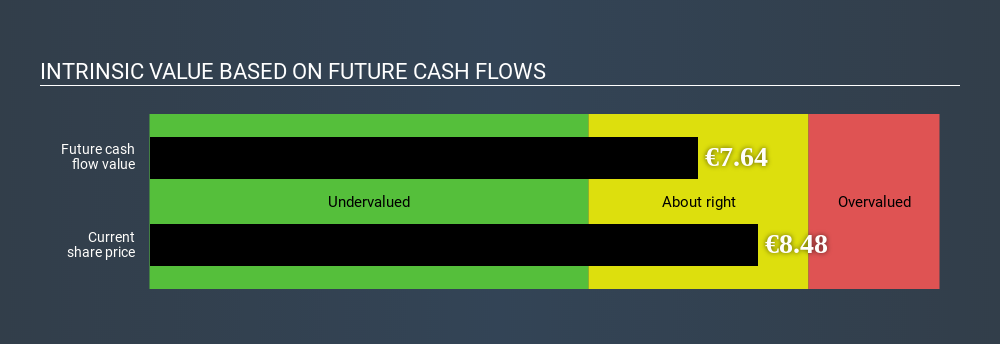
The total value, or equity value, is then the sum of the present value of the future cash flows, which in this case is €388m. To get the intrinsic value per share, we divide this by the total number of shares outstanding. Compared to the current share price of €8.4, the company appears around fair value at the time of writing. The assumptions in any calculation have a big impact on the valuation, so it is better to view this as a rough estimate, not precise down to the last cent.
The assumptions
The calculation above is very dependent on two assumptions. The first is the discount rate and the other is the cash flows. If you don't agree with these result, have a go at the calculation yourself and play with the assumptions. The DCF also does not consider the possible cyclicality of an industry, or a company's future capital requirements, so it does not give a full picture of a company's potential performance. Given that we are looking at F.I.L.A. - Fabbrica Italiana Lapis ed Affini as potential shareholders, the cost of equity is used as the discount rate, rather than the cost of capital (or weighted average cost of capital, WACC) which accounts for debt. In this calculation we've used 17%, which is based on a levered beta of 1.525. Beta is a measure of a stock's volatility, compared to the market as a whole. We get our beta from the industry average beta of globally comparable companies, with an imposed limit between 0.8 and 2.0, which is a reasonable range for a stable business.
Next Steps:
Valuation is only one side of the coin in terms of building your investment thesis, and it shouldn’t be the only metric you look at when researching a company. The DCF model is not a perfect stock valuation tool. Rather it should be seen as a guide to "what assumptions need to be true for this stock to be under/overvalued?" If a company grows at a different rate, or if its cost of equity or risk free rate changes sharply, the output can look very different. For F.I.L.A. - Fabbrica Italiana Lapis ed Affini, We've put together three fundamental factors you should further research:
- Risks: Every company has them, and we've spotted 2 warning signs for F.I.L.A. - Fabbrica Italiana Lapis ed Affini (of which 1 is a bit unpleasant!) you should know about.
- Future Earnings: How does FILA's growth rate compare to its peers and the wider market? Dig deeper into the analyst consensus number for the upcoming years by interacting with our free analyst growth expectation chart.
- Other Solid Businesses: Low debt, high returns on equity and good past performance are fundamental to a strong business. Why not explore our interactive list of stocks with solid business fundamentals to see if there are other companies you may not have considered!
PS. Simply Wall St updates its DCF calculation for every IT stock every day, so if you want to find the intrinsic value of any other stock just search here.
Love or hate this article? Concerned about the content? Get in touch with us directly. Alternatively, email editorial-team@simplywallst.com.
This article by Simply Wall St is general in nature. It does not constitute a recommendation to buy or sell any stock, and does not take account of your objectives, or your financial situation. We aim to bring you long-term focused analysis driven by fundamental data. Note that our analysis may not factor in the latest price-sensitive company announcements or qualitative material. Simply Wall St has no position in any stocks mentioned. Thank you for reading.
About BIT:FILA
F.I.L.A. - Fabbrica Italiana Lapis ed Affini
F.I.L.A. - Fabbrica Italiana Lapis ed Affini S.p.A.
Undervalued with excellent balance sheet and pays a dividend.
Similar Companies
Market Insights

Weekly Picks

THE KINGDOM OF BROWN GOODS: WHY MGPI IS BEING CRUSHED BY INVENTORY & PRIMED FOR RESURRECTION


Why Vertical Aerospace (NYSE: EVTL) is Worth Possibly Over 13x its Current Price


The Quiet Giant That Became AI’s Power Grid
Recently Updated Narratives


MINISO's fair value is projected at 26.69 with an anticipated PE ratio shift of 20x

Fiverr International will transform the freelance industry with AI-powered growth

Stride Stock: Online Education Finds Its Second Act
Popular Narratives


MicroVision will explode future revenue by 380.37% with a vision towards success


Crazy Undervalued 42 Baggers Silver Play (Active & Running Mine)


