
Advertisement
- United States
- /
- Transportation
- /
- NYSE:XPO
A Sliding Share Price Has Us Looking At XPO Logistics, Inc.'s (NYSE:XPO) P/E Ratio

To the annoyance of some shareholders, XPO Logistics (NYSE:XPO) shares are down a considerable 57% in the last month. The recent drop has obliterated the annual return, with the share price now down 15% over that longer period.
Assuming nothing else has changed, a lower share price makes a stock more attractive to potential buyers. In the long term, share prices tend to follow earnings per share, but in the short term prices bounce around in response to short term factors (which are not always obvious). The implication here is that long term investors have an opportunity when expectations of a company are too low. Perhaps the simplest way to get a read on investors' expectations of a business is to look at its Price to Earnings Ratio (PE Ratio). A high P/E ratio means that investors have a high expectation about future growth, while a low P/E ratio means they have low expectations about future growth.
Check out our latest analysis for XPO Logistics
Does XPO Logistics Have A Relatively High Or Low P/E For Its Industry?
XPO Logistics's P/E of 10.63 indicates relatively low sentiment towards the stock. The image below shows that XPO Logistics has a lower P/E than the average (16.8) P/E for companies in the logistics industry.
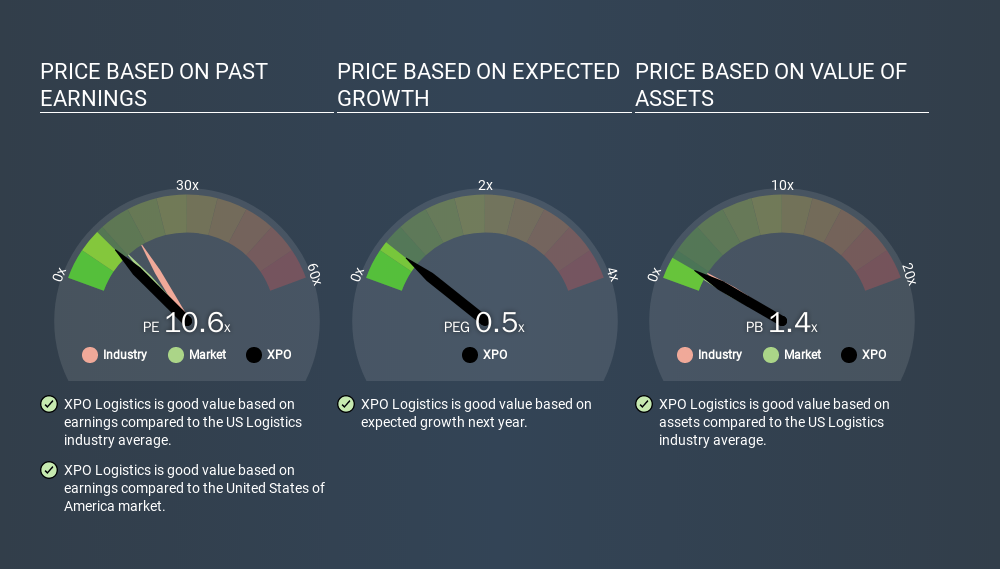
XPO Logistics's P/E tells us that market participants think it will not fare as well as its peers in the same industry. Since the market seems unimpressed with XPO Logistics, it's quite possible it could surprise on the upside. You should delve deeper. I like to check if company insiders have been buying or selling.
How Growth Rates Impact P/E Ratios
Earnings growth rates have a big influence on P/E ratios. When earnings grow, the 'E' increases, over time. Therefore, even if you pay a high multiple of earnings now, that multiple will become lower in the future. So while a stock may look expensive based on past earnings, it could be cheap based on future earnings.
It's great to see that XPO Logistics grew EPS by 25% in the last year. And it has improved its earnings per share by 90% per year over the last three years. So one might expect an above average P/E ratio.
Remember: P/E Ratios Don't Consider The Balance Sheet
It's important to note that the P/E ratio considers the market capitalization, not the enterprise value. In other words, it does not consider any debt or cash that the company may have on the balance sheet. Hypothetically, a company could reduce its future P/E ratio by spending its cash (or taking on debt) to achieve higher earnings.
Such expenditure might be good or bad, in the long term, but the point here is that the balance sheet is not reflected by this ratio.
So What Does XPO Logistics's Balance Sheet Tell Us?
Net debt totals a substantial 118% of XPO Logistics's market cap. If you want to compare its P/E ratio to other companies, you must keep in mind that these debt levels would usually warrant a relatively low P/E.
The Verdict On XPO Logistics's P/E Ratio
XPO Logistics trades on a P/E ratio of 10.6, which is below the US market average of 12.2. The company has a meaningful amount of debt on the balance sheet, but that should not eclipse the solid earnings growth. If the company can continue to grow earnings, then the current P/E may be unjustifiably low. What can be absolutely certain is that the market has become significantly less optimistic about XPO Logistics over the last month, with the P/E ratio falling from 24.7 back then to 10.6 today. For those who don't like to trade against momentum, that could be a warning sign, but a contrarian investor might want to take a closer look.
Investors have an opportunity when market expectations about a stock are wrong. If it is underestimating a company, investors can make money by buying and holding the shares until the market corrects itself. So this free visual report on analyst forecasts could hold the key to an excellent investment decision.
Of course, you might find a fantastic investment by looking at a few good candidates. So take a peek at this free list of companies with modest (or no) debt, trading on a P/E below 20.
If you spot an error that warrants correction, please contact the editor at editorial-team@simplywallst.com. This article by Simply Wall St is general in nature. It does not constitute a recommendation to buy or sell any stock, and does not take account of your objectives, or your financial situation. Simply Wall St has no position in the stocks mentioned.
We aim to bring you long-term focused research analysis driven by fundamental data. Note that our analysis may not factor in the latest price-sensitive company announcements or qualitative material. Thank you for reading.
About NYSE:XPO
XPO
Provides freight transportation services in the United States, North America, France, the United Kingdom, and rest of Europe.
Solid track record with adequate balance sheet.
Market Insights


Advertisement
Community Narratives
The Future of Drug Testing? Fingerprint Tech Shows Serious Promise
Fair Value US$2.98|40.3% undervalued
JO
Community Contributor
Suncorp’s Next Chapter: Insurance-Only and Ready to Grow
Fair Value AU$22.83|7.6% undervalued
RO
Community Contributor
Thyssenkrupp Nucera Will Achieve Double-Digit Profits by 2030 Boosted by Hydrogen Growth
Fair Value €14.40|31.6% undervalued
CH
Community Contributor
Tesla’s Nvidia Moment – The AI & Robotics Inflection Point
Fair Value US$359.72|12.3% undervalued
BL
Community Contributor