Advertisement
- Saudi Arabia
- /
- Banks
- /
- SASE:1150
3 Middle Eastern Dividend Stocks Yielding Up To 7.0%

Simply Wall St
Reviewed by Simply Wall St

The Middle Eastern stock markets have recently seen a rebound, driven by positive corporate earnings and optimism surrounding international trade deals, such as the U.S.-Japan agreement. In this dynamic environment, dividend stocks can offer investors a reliable income stream, especially when companies continue to perform well amidst external economic pressures.
Top 10 Dividend Stocks In The Middle East
| Name | Dividend Yield | Dividend Rating |
| Saudi Telecom (SASE:7010) | 9.98% | ★★★★★☆ |
| Saudi National Bank (SASE:1180) | 5.44% | ★★★★★☆ |
| Saudi Awwal Bank (SASE:1060) | 6.11% | ★★★★★☆ |
| Riyad Bank (SASE:1010) | 6.45% | ★★★★★☆ |
| National Bank of Ras Al-Khaimah (P.S.C.) (ADX:RAKBANK) | 6.44% | ★★★★★☆ |
| Emirates NBD Bank PJSC (DFM:EMIRATESNBD) | 3.77% | ★★★★★☆ |
| Emaar Properties PJSC (DFM:EMAAR) | 6.62% | ★★★★★☆ |
| Commercial Bank of Dubai PSC (DFM:CBD) | 5.34% | ★★★★★☆ |
| Arab National Bank (SASE:1080) | 6.11% | ★★★★★☆ |
| Anadolu Hayat Emeklilik Anonim Sirketi (IBSE:ANHYT) | 6.81% | ★★★★★☆ |
Click here to see the full list of 76 stocks from our Top Middle Eastern Dividend Stocks screener.
Here's a peek at a few of the choices from the screener.
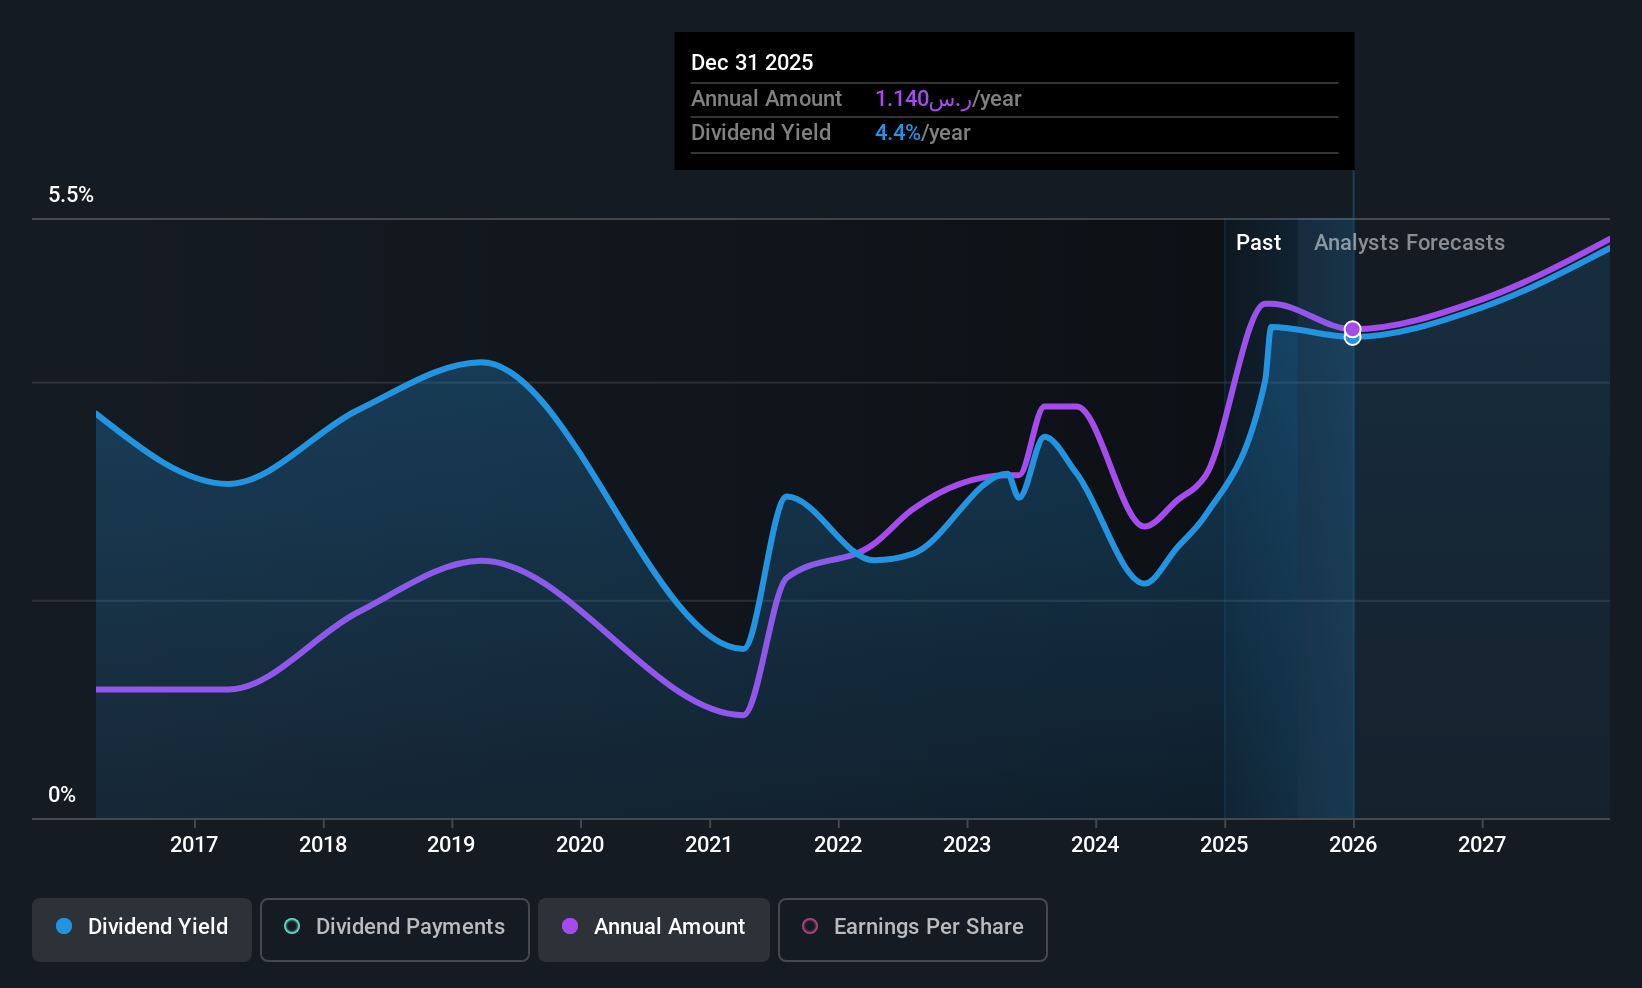
Alinma Bank (SASE:1150)
Simply Wall St Dividend Rating: ★★★★☆☆
Overview: Alinma Bank offers banking and investment services in the Kingdom of Saudi Arabia with a market cap of SAR65.55 billion.
Operations: Alinma Bank's revenue segments consist of Retail at SAR5.21 billion, Treasury at SAR1.77 billion, Corporate Banking at SAR2.18 billion, and Investment and Brokerage at SAR1.02 billion.
Dividend Yield: 4.6%
Alinma Bank's dividend payments have been volatile over the past decade, despite a reasonable payout ratio of 51.2% indicating coverage by earnings. The bank's dividend yield of 4.57% is below the top tier in Saudi Arabia, and its dividends are forecast to remain covered by earnings in three years with a payout ratio of 53.7%. Recent executive changes include appointing Mr. Abdullah Al Khalifa as Managing Director alongside his CEO role, potentially influencing future strategic directions.
- Click to explore a detailed breakdown of our findings in Alinma Bank's dividend report.
- In light of our recent valuation report, it seems possible that Alinma Bank is trading beyond its estimated value.
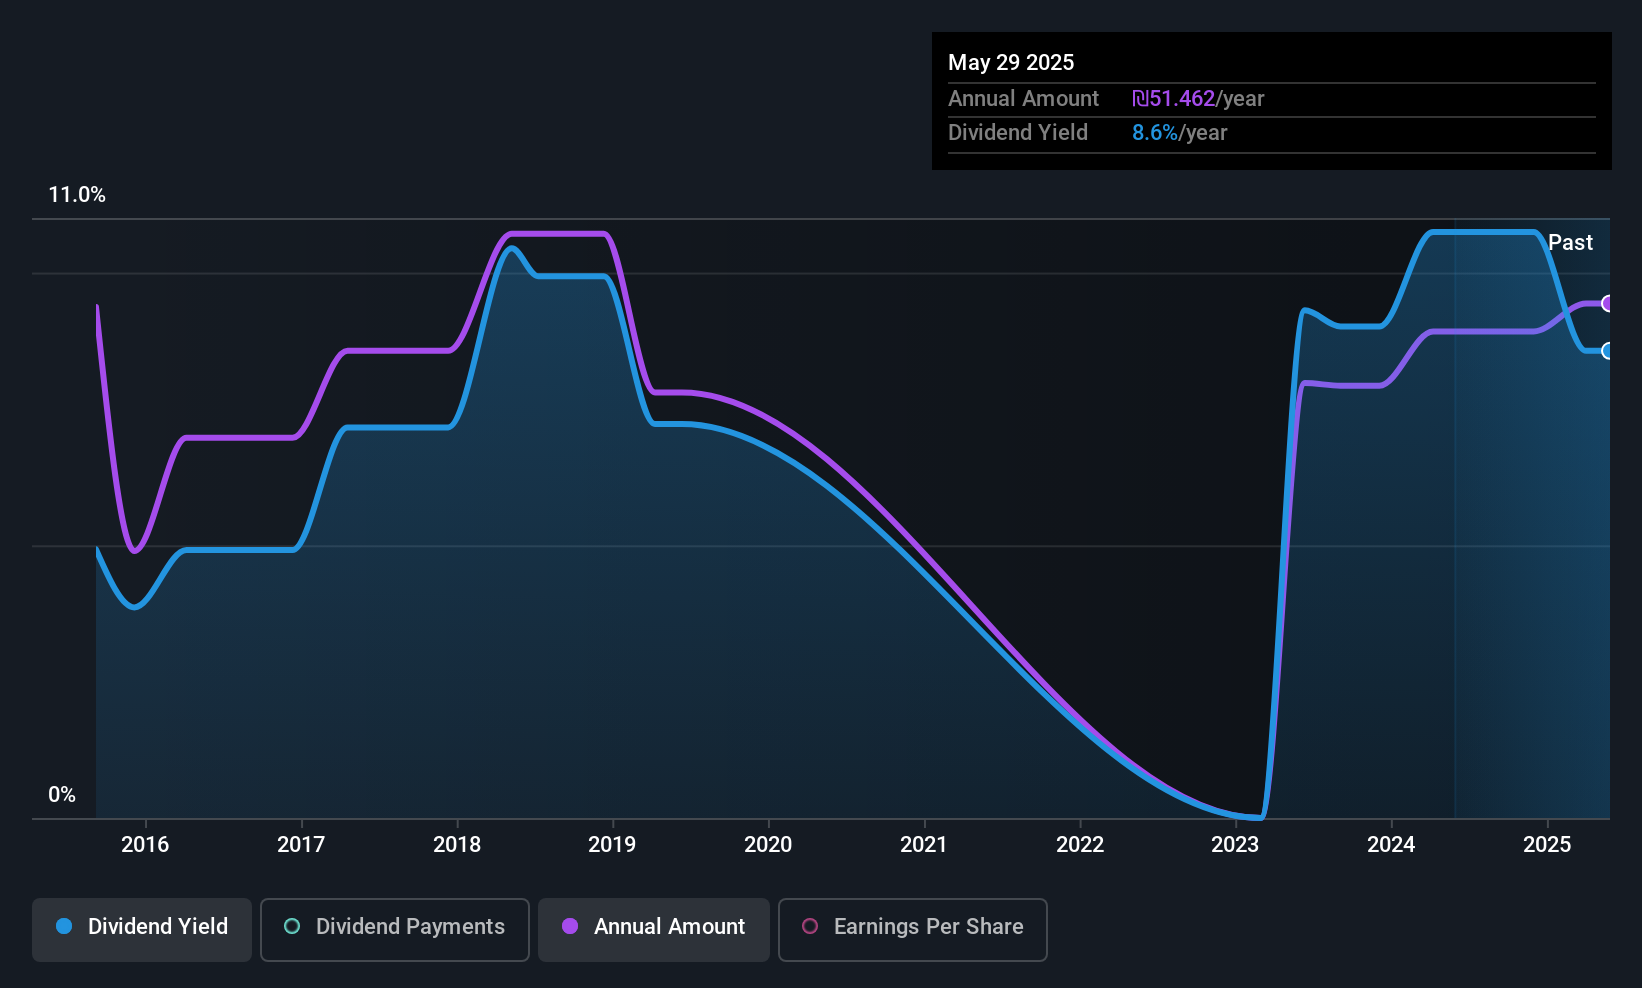
Amir Marketing and Investments in Agriculture (TASE:AMRK)
Simply Wall St Dividend Rating: ★★★★☆☆
Overview: Amir Marketing and Investments in Agriculture Ltd is an Israeli company that supplies and markets agricultural inputs, with a market cap of ₪421.17 million.
Operations: Amir Marketing and Investments in Agriculture Ltd generates revenue from several segments, including Mixtures (₪299.39 million), Packaging (₪239.96 million), Real Estate (₪4.94 million), and Plant Protection and Nutrition (₪546.70 million).
Dividend Yield: 3.6%
Amir Marketing and Investments in Agriculture offers a dividend yield of 3.56%, lower than the IL market's top tier, yet its dividends are well covered by both earnings (payout ratio: 33.8%) and cash flows (cash payout ratio: 27.5%). Despite a history of volatility, dividends have grown over the past decade. The company reported stable first-quarter earnings with sales at ILS 274.17 million and net income slightly down to ILS 10.4 million year-on-year.
- Get an in-depth perspective on Amir Marketing and Investments in Agriculture's performance by reading our dividend report here.
- The valuation report we've compiled suggests that Amir Marketing and Investments in Agriculture's current price could be inflated.

Delek Group (TASE:DLEKG)
Simply Wall St Dividend Rating: ★★★★☆☆
Overview: Delek Group Ltd. is an energy company involved in the exploration, development, production, and marketing of oil and gas both in Israel and internationally, with a market cap of ₪13.34 billion.
Operations: Delek Group Ltd. generates revenue primarily from the development and production of oil and gas assets in the North Sea, amounting to ₪8.12 billion, and from oil and gas exploration and production activities in Israel and its surroundings, contributing ₪3.72 billion.
Dividend Yield: 7.1%
Delek Group's dividend yield of 7.05% is among the top in the IL market, yet its sustainability is questionable due to a high payout ratio of 91.6%, indicating dividends are not well covered by earnings. Although dividend payments have increased over the past decade, they have been volatile and unreliable. Recent earnings show a decline with net income at ILS 10 million for Q1 2025, down from ILS 269 million a year ago, highlighting potential financial challenges despite strong sales growth to ILS 3.85 billion.
- Navigate through the intricacies of Delek Group with our comprehensive dividend report here.
- According our valuation report, there's an indication that Delek Group's share price might be on the cheaper side.
Next Steps
- Unlock our comprehensive list of 76 Top Middle Eastern Dividend Stocks by clicking here.
- Invested in any of these stocks? Simplify your portfolio management with Simply Wall St and stay ahead with our alerts for any critical updates on your stocks.
- Discover a world of investment opportunities with Simply Wall St's free app and access unparalleled stock analysis across all markets.
Ready For A Different Approach?
- Explore high-performing small cap companies that haven't yet garnered significant analyst attention.
- Fuel your portfolio with companies showing strong growth potential, backed by optimistic outlooks both from analysts and management.
- Find companies with promising cash flow potential yet trading below their fair value.
This article by Simply Wall St is general in nature. We provide commentary based on historical data and analyst forecasts only using an unbiased methodology and our articles are not intended to be financial advice. It does not constitute a recommendation to buy or sell any stock, and does not take account of your objectives, or your financial situation. We aim to bring you long-term focused analysis driven by fundamental data. Note that our analysis may not factor in the latest price-sensitive company announcements or qualitative material. Simply Wall St has no position in any stocks mentioned.
New: Manage All Your Stock Portfolios in One Place
We've created the ultimate portfolio companion for stock investors, and it's free.
• Connect an unlimited number of Portfolios and see your total in one currency
• Be alerted to new Warning Signs or Risks via email or mobile
• Track the Fair Value of your stocks
Have feedback on this article? Concerned about the content? Get in touch with us directly. Alternatively, email editorial-team@simplywallst.com
About SASE:1150
Alinma Bank
Provides banking and investment services in the Kingdom of Saudi Arabia.
Flawless balance sheet average dividend payer.
Market Insights

Advertisement
Community Narratives
Pole position to benefit from GENIUS Act
Fair Value US$233.04|58.8% undervalued
CH
Community Contributor
IREN will transform from bitcoin miner to leader in AI infrastructure
Fair Value US$21.48|11.6% undervalued
KA
Community Contributor
Behind the Assay: XRF Scientific’s Role in Modern Mining Economics
Fair Value AU$2.10|1.4% undervalued
RO
Community Contributor