Advertisement
- South Korea
- /
- Electrical
- /
- KOSE:A010120
3 Global Stocks That May Be Trading 20.2% To 37.7% Below Their Estimated Intrinsic Value

Simply Wall St
Reviewed by Simply Wall St
As global markets navigate through a period of mixed signals, with the U.S. Federal Reserve hinting at potential rate cuts and varying performances across major indices, investors are keenly observing opportunities that may arise in this evolving landscape. In such an environment, identifying stocks trading below their intrinsic value can be particularly appealing as they offer potential for growth when market conditions stabilize or improve.
Top 10 Undervalued Stocks Based On Cash Flows
| Name | Current Price | Fair Value (Est) | Discount (Est) |
| Xiamen Amoytop Biotech (SHSE:688278) | CN¥84.02 | CN¥165.09 | 49.1% |
| TOWA (TSE:6315) | ¥1665.00 | ¥3327.41 | 50% |
| Takara Bio (TSE:4974) | ¥932.00 | ¥1829.46 | 49.1% |
| Q & M Dental Group (Singapore) (SGX:QC7) | SGD0.485 | SGD0.97 | 49.8% |
| Hanza (OM:HANZA) | SEK112.00 | SEK220.70 | 49.3% |
| E-Globe (BIT:EGB) | €0.665 | €1.32 | 49.6% |
| Corporativo Fragua. de (BMV:FRAGUA B) | MX$536.87 | MX$1061.81 | 49.4% |
| Chifeng Jilong Gold MiningLtd (SHSE:600988) | CN¥25.57 | CN¥50.36 | 49.2% |
| Aquila Part Prod Com (BVB:AQ) | RON1.45 | RON2.84 | 49% |
| Apotea (OM:APOTEA) | SEK106.44 | SEK209.15 | 49.1% |
We're going to check out a few of the best picks from our screener tool.
Duk San NeoluxLtd (KOSDAQ:A213420)
Overview: Duk San Neolux Co., Ltd specializes in developing and manufacturing OLED materials for the display industry in South Korea, with a market cap of ₩1.13 trillion.
Operations: The company generates revenue primarily from its semiconductor segment, amounting to ₩197.71 billion.
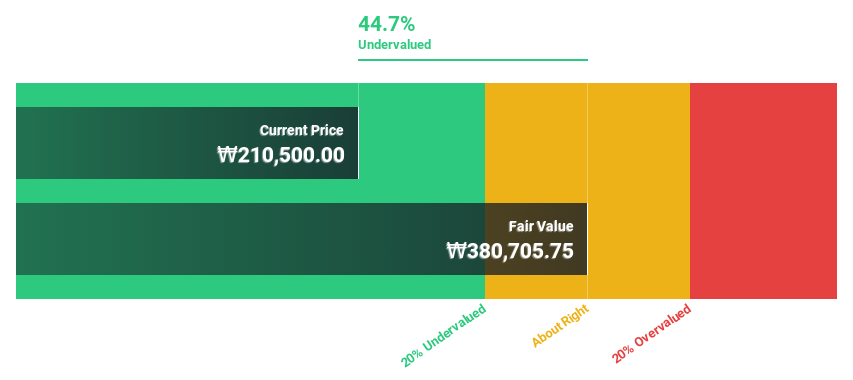
Estimated Discount To Fair Value: 30.5%
Duk San Neolux Ltd. is trading at a significant discount to its estimated fair value of ₩66,095.94, with a current price of ₩45,950. The company's revenue and earnings are expected to grow significantly faster than the market, at 24.9% and 28.8% per year respectively. Despite this growth potential, the stock has experienced high volatility recently and its return on equity is forecasted to remain low at 16.4%.
- The growth report we've compiled suggests that Duk San NeoluxLtd's future prospects could be on the up.
- Get an in-depth perspective on Duk San NeoluxLtd's balance sheet by reading our health report here.
LS ELECTRIC (KOSE:A010120)
Overview: LS ELECTRIC Co., Ltd. offers smart energy solutions both in South Korea and internationally, with a market cap of ₩8.51 trillion.
Operations: The company's revenue segments include smart energy solutions provided both domestically and internationally.
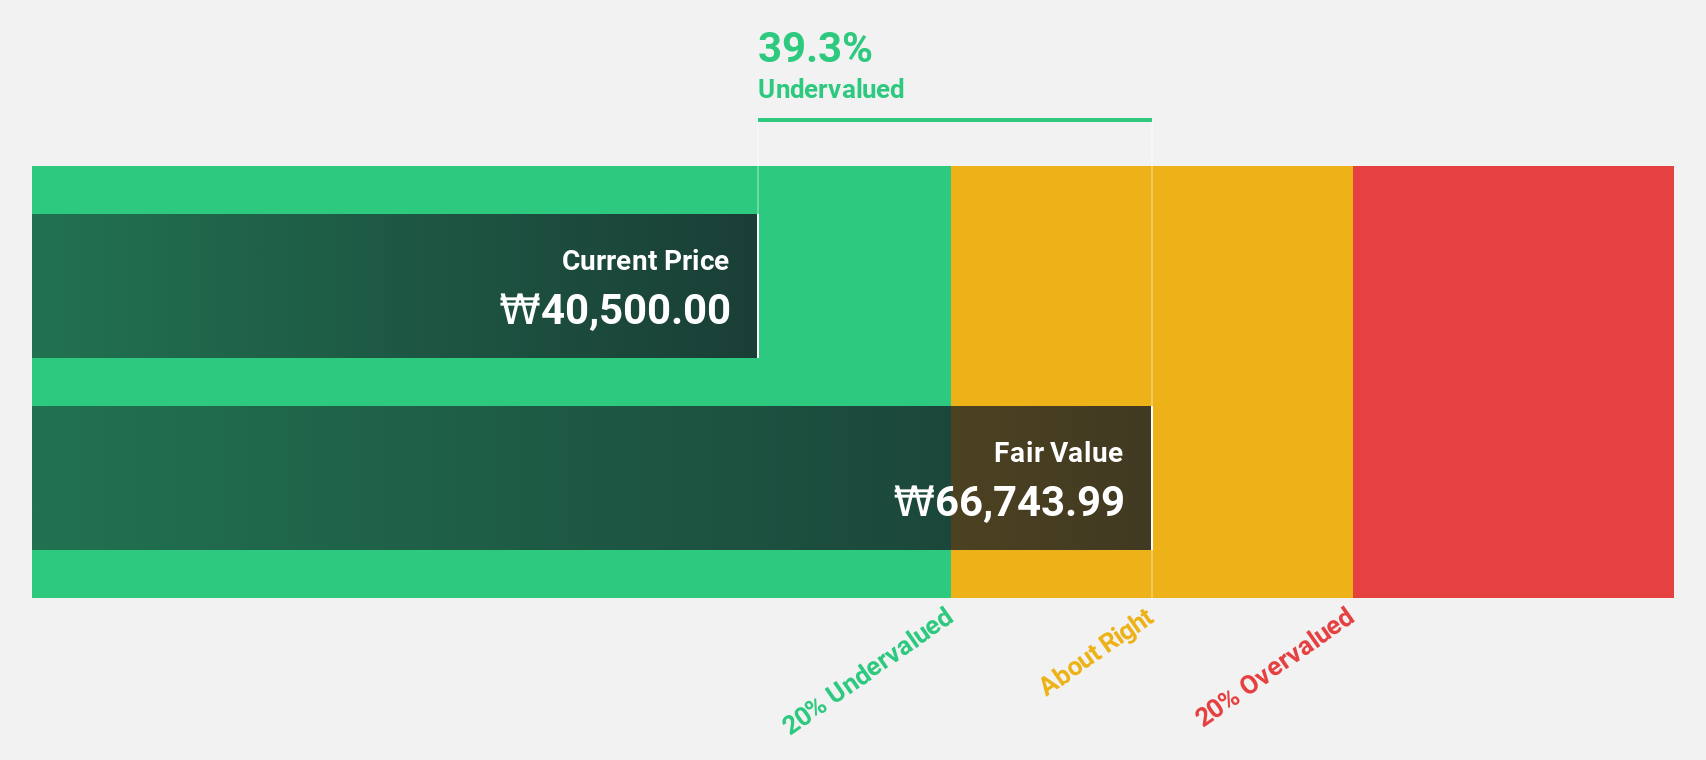
Estimated Discount To Fair Value: 20.2%
LS ELECTRIC is trading at ₩284,500, which is over 20% below its estimated fair value of ₩356,695.07. Earnings have grown annually by 26.6% over the past five years and are forecast to increase by 27.49% per year, outpacing the KR market's growth expectations. Despite recent share price volatility, revenue is projected to grow at a robust rate of 11% per year. However, the company's return on equity remains modestly low at a forecasted 18.9%.
- Our comprehensive growth report raises the possibility that LS ELECTRIC is poised for substantial financial growth.
- Unlock comprehensive insights into our analysis of LS ELECTRIC stock in this financial health report.
GMO internet group (TSE:9449)
Overview: GMO Internet Group, Inc. offers a range of internet services globally and has a market cap of approximately ¥393.57 billion.
Operations: The company's revenue segments include Internet Infrastructure, Online Advertising & Media, Internet Finance, and Cryptoassets.
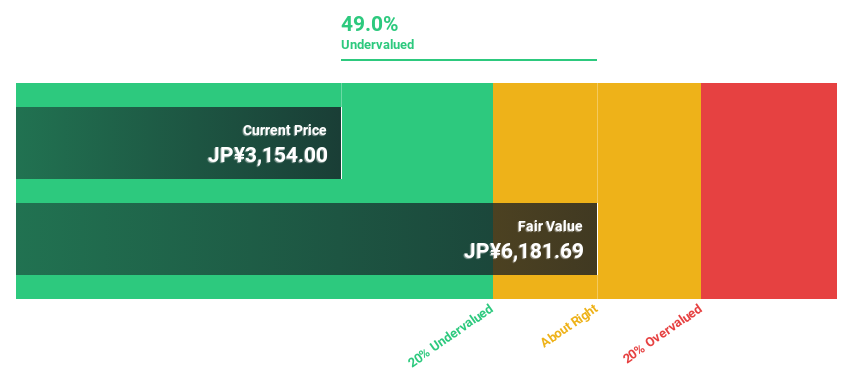
Estimated Discount To Fair Value: 37.7%
GMO Internet Group is trading at ¥3,944, significantly below its estimated fair value of ¥6,326.04. The company's earnings are projected to grow at 15.8% annually, surpassing the JP market's 8.2%. Despite a slight dividend decrease to ¥16.80 per share for Q2 2025, GMO's robust revenue growth forecast of 8.1% and strategic buybacks totaling ¥8.89 billion underscore its strong cash flow positioning and commitment to shareholder value enhancement amidst competitive cybersecurity achievements.
- The analysis detailed in our GMO internet group growth report hints at robust future financial performance.
- Delve into the full analysis health report here for a deeper understanding of GMO internet group.
Taking Advantage
- Reveal the 508 hidden gems among our Undervalued Global Stocks Based On Cash Flows screener with a single click here.
- Are any of these part of your asset mix? Tap into the analytical power of Simply Wall St's portfolio to get a 360-degree view on how they're shaping up.
- Enhance your investing ability with the Simply Wall St app and enjoy free access to essential market intelligence spanning every continent.
Looking For Alternative Opportunities?
- Explore high-performing small cap companies that haven't yet garnered significant analyst attention.
- Diversify your portfolio with solid dividend payers offering reliable income streams to weather potential market turbulence.
- Fuel your portfolio with companies showing strong growth potential, backed by optimistic outlooks both from analysts and management.
This article by Simply Wall St is general in nature. We provide commentary based on historical data and analyst forecasts only using an unbiased methodology and our articles are not intended to be financial advice. It does not constitute a recommendation to buy or sell any stock, and does not take account of your objectives, or your financial situation. We aim to bring you long-term focused analysis driven by fundamental data. Note that our analysis may not factor in the latest price-sensitive company announcements or qualitative material. Simply Wall St has no position in any stocks mentioned.
New: AI Stock Screener & Alerts
Our new AI Stock Screener scans the market every day to uncover opportunities.
• Dividend Powerhouses (3%+ Yield)
• Undervalued Small Caps with Insider Buying
• High growth Tech and AI Companies
Or build your own from over 50 metrics.
Have feedback on this article? Concerned about the content? Get in touch with us directly. Alternatively, email editorial-team@simplywallst.com
About KOSE:A010120
LS ELECTRIC
Provides smart energy solutions in South Korea and internationally.
Excellent balance sheet with reasonable growth potential.
Similar Companies
Market Insights


Advertisement
Community Narratives
100% Patient Improvement in trial puts this $16M Biotech on the radar
Fair Value US$5.30|74.7% undervalued
JO
Community Contributor
PayPal's Future Growth Through Venmo and Merchant Solutions
Fair Value US$105.25|35.0% undervalued
ZW
Community Contributor
IREN's Bold Moves in Sustainable Bitcoin Mining & AI Data Centers
Fair Value US$26.54|1.5% undervalued
BL
Community Contributor