- United States
- /
- Media
- /
- NasdaqGM:TTD
Rocket Lab USA Among 3 Stocks Estimated To Be Priced Below Intrinsic Value

Reviewed by Simply Wall St

The United States market has shown a robust performance, increasing by 7.0% over the last week and 7.5% over the past year, with earnings projected to grow by 14% annually in the coming years. In such an environment, identifying stocks that are priced below their intrinsic value can offer opportunities for investors seeking to capitalize on potential growth and value misalignments.
Top 10 Undervalued Stocks Based On Cash Flows In The United States
| Name | Current Price | Fair Value (Est) | Discount (Est) |
| Mid Penn Bancorp (NasdaqGM:MPB) | $27.77 | $54.03 | 48.6% |
| Trade Desk (NasdaqGM:TTD) | $53.97 | $106.40 | 49.3% |
| First Reliance Bancshares (OTCPK:FSRL) | $9.35 | $18.65 | 49.9% |
| Ready Capital (NYSE:RC) | $4.42 | $8.65 | 48.9% |
| Shift4 Payments (NYSE:FOUR) | $80.28 | $158.86 | 49.5% |
| Veracyte (NasdaqGM:VCYT) | $32.23 | $62.85 | 48.7% |
| Verra Mobility (NasdaqCM:VRRM) | $21.91 | $43.04 | 49.1% |
| StoneCo (NasdaqGS:STNE) | $13.75 | $26.97 | 49% |
| Constellium (NYSE:CSTM) | $9.30 | $18.52 | 49.8% |
| RXO (NYSE:RXO) | $13.48 | $26.56 | 49.3% |
Here we highlight a subset of our preferred stocks from the screener.
Rocket Lab USA (NasdaqCM:RKLB)
Overview: Rocket Lab USA, Inc. is a space company offering launch services and space systems solutions across the United States, Canada, Japan, and internationally with a market cap of $10.15 billion.
Operations: The company generates revenue from two main segments: Space Systems, contributing $310.84 million, and Launch Services, accounting for $125.38 million.
Estimated Discount To Fair Value: 45.7%
Rocket Lab USA is trading at US$22.38, significantly below its estimated fair value of US$41.22, suggesting potential undervaluation based on discounted cash flow analysis. Despite recent insider selling and share price volatility, the company is expected to achieve profitability within three years with revenue growth projected above market rates. Recent contracts with major defense programs like MACH-TB 2.0 highlight Rocket Lab's expanding role in hypersonic technology testing and national security missions, potentially enhancing future cash flows.
- The analysis detailed in our Rocket Lab USA growth report hints at robust future financial performance.
- Click here and access our complete balance sheet health report to understand the dynamics of Rocket Lab USA.
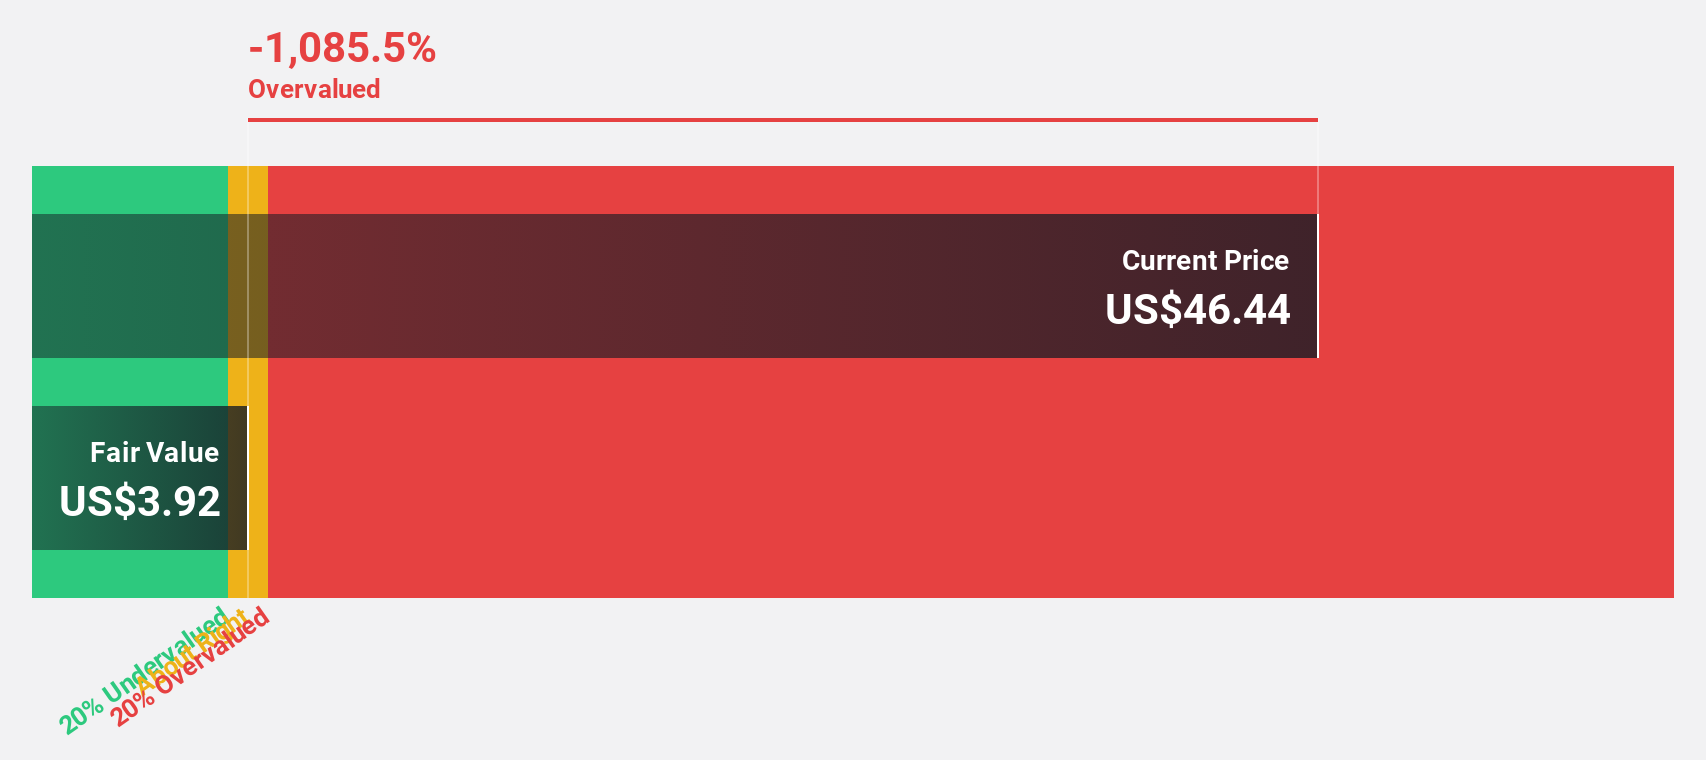
Trade Desk (NasdaqGM:TTD)
Overview: The Trade Desk, Inc. is a technology company that operates in the United States and internationally, with a market cap of approximately $26.53 billion.
Operations: The company's revenue primarily comes from its advertising technology platform, generating approximately $2.44 billion.
Estimated Discount To Fair Value: 49.3%
Trade Desk, trading at US$53.97, is significantly below its estimated fair value of US$106.4, indicating potential undervaluation based on cash flow analysis. Despite recent share price volatility and ongoing legal challenges related to Kokai's rollout, earnings are projected to grow faster than the market at 21.8% annually. Strategic partnerships like those with Cineverse and Perion Network enhance Trade Desk's advertising technology capabilities, potentially boosting future revenue streams despite current operational hurdles.
- In light of our recent growth report, it seems possible that Trade Desk's financial performance will exceed current levels.
- Dive into the specifics of Trade Desk here with our thorough financial health report.
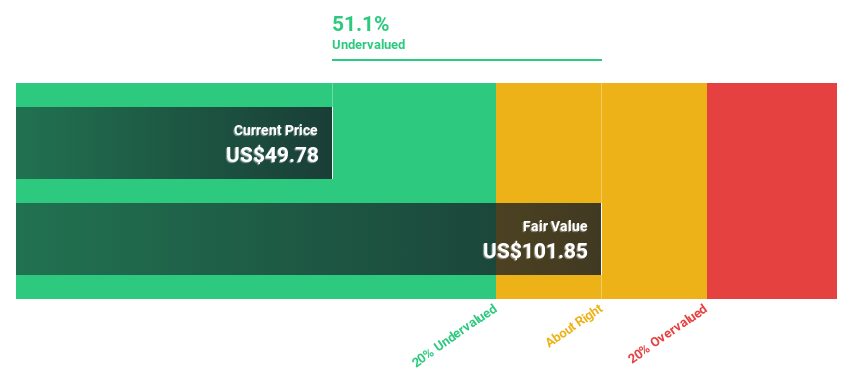
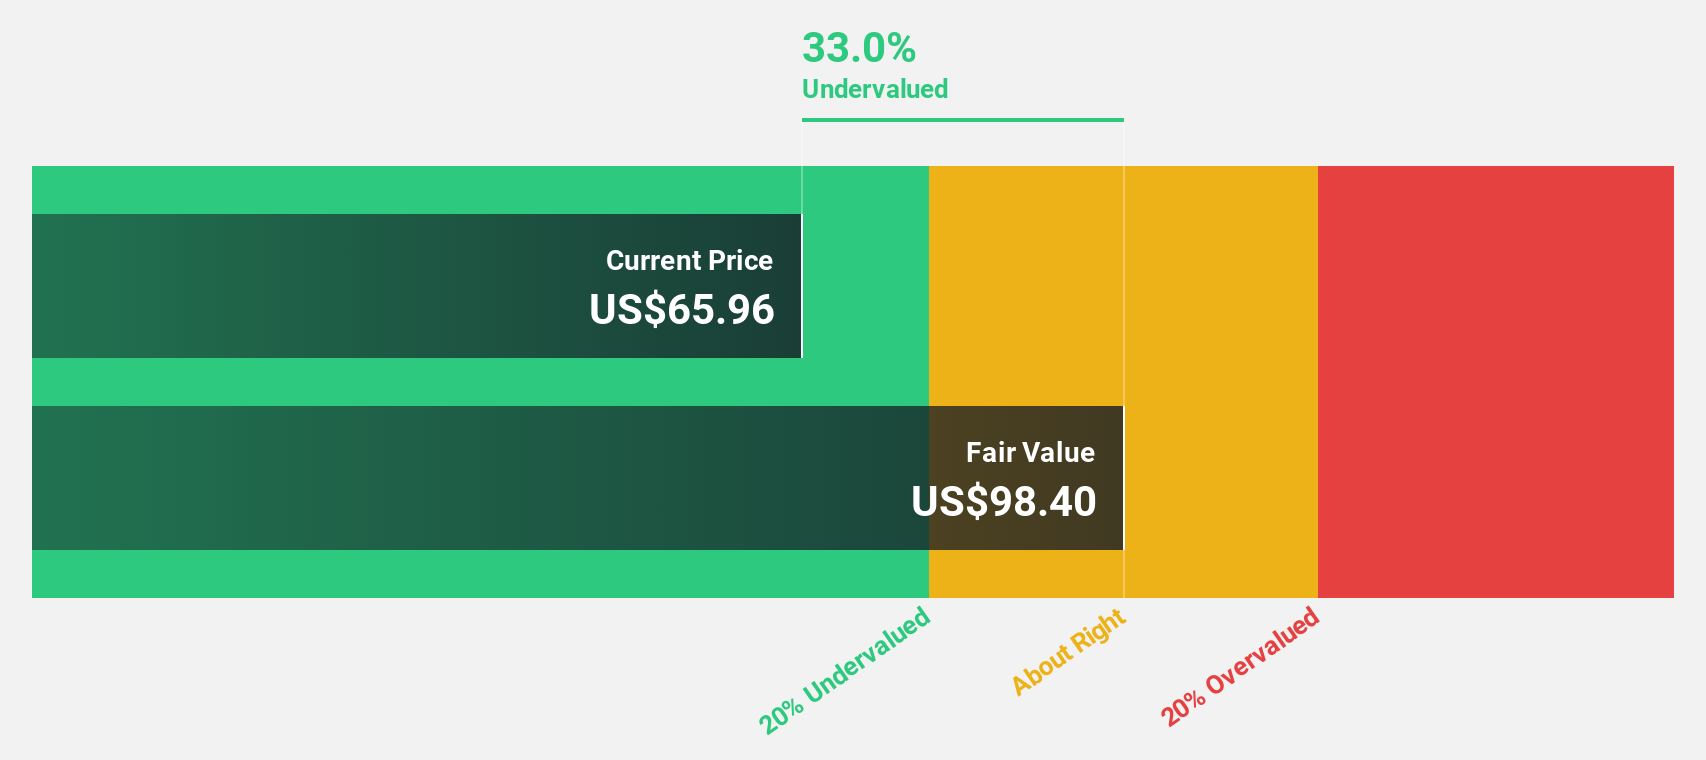
Zillow Group (NasdaqGS:ZG)
Overview: Zillow Group, Inc. operates real estate brands through mobile applications and websites in the United States, with a market cap of approximately $15.93 billion.
Operations: The company generates revenue from its Internet, Media & Technology segment, excluding mortgages, amounting to $2.24 billion.
Estimated Discount To Fair Value: 35.8%
Zillow Group, trading at US$65.19, is significantly undervalued based on cash flow analysis with an estimated fair value of US$101.51. Despite recent losses, Zillow's strategic initiatives like the partnership with Epique Realty and the launch of AI-powered Zillow Showcase enhance its competitive edge in real estate listings. Revenue growth is expected to outpace the market at 11.9% annually, while profitability forecasts suggest above-average market growth over the next three years.
- According our earnings growth report, there's an indication that Zillow Group might be ready to expand.
- Click here to discover the nuances of Zillow Group with our detailed financial health report.
Summing It All Up
- Take a closer look at our Undervalued US Stocks Based On Cash Flows list of 178 companies by clicking here.
- Are these companies part of your investment strategy? Use Simply Wall St to consolidate your holdings into a portfolio and gain insights with our comprehensive analysis tools.
- Enhance your investing ability with the Simply Wall St app and enjoy free access to essential market intelligence spanning every continent.
Looking For Alternative Opportunities?
- Explore high-performing small cap companies that haven't yet garnered significant analyst attention.
- Diversify your portfolio with solid dividend payers offering reliable income streams to weather potential market turbulence.
- Fuel your portfolio with companies showing strong growth potential, backed by optimistic outlooks both from analysts and management.
This article by Simply Wall St is general in nature. We provide commentary based on historical data and analyst forecasts only using an unbiased methodology and our articles are not intended to be financial advice. It does not constitute a recommendation to buy or sell any stock, and does not take account of your objectives, or your financial situation. We aim to bring you long-term focused analysis driven by fundamental data. Note that our analysis may not factor in the latest price-sensitive company announcements or qualitative material. Simply Wall St has no position in any stocks mentioned.
If you're looking to trade Trade Desk, open an account with the lowest-cost platform trusted by professionals, Interactive Brokers.
With clients in over 200 countries and territories, and access to 160 markets, IBKR lets you trade stocks, options, futures, forex, bonds and funds from a single integrated account.
Enjoy no hidden fees, no account minimums, and FX conversion rates as low as 0.03%, far better than what most brokers offer.
Sponsored ContentValuation is complex, but we're here to simplify it.
Discover if Trade Desk might be undervalued or overvalued with our detailed analysis, featuring fair value estimates, potential risks, dividends, insider trades, and its financial condition.
Access Free AnalysisHave feedback on this article? Concerned about the content? Get in touch with us directly. Alternatively, email editorial-team@simplywallst.com
About NasdaqGM:TTD
Trade Desk
Operates as a technology company in the United States and internationally.
Flawless balance sheet with high growth potential.
Similar Companies
Market Insights

Community Narratives

