
Last Update 13 Jun 26
Fair value Decreased 11%EVGO: Charging Buildout And 2026 Revenue Guidance Will Drive Upside
Analysts have trimmed their price target on EVgo to $4.25 from $4.75, citing updated assumptions around discount rates, revenue growth, profit margins, and future P/E. This change comes alongside a recent reset in Street positioning, with EVgo now rated Neutral at some firms.
What's in the News
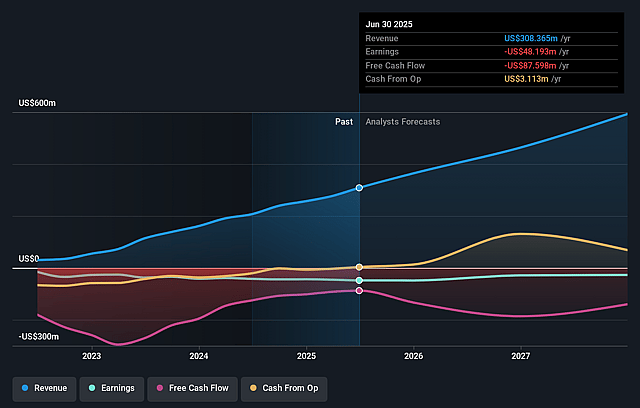
- EVgo issued earnings guidance for the second quarter of 2026, with management expecting total revenue of US$75 million to US$85 million. Source: Company guidance.
- The company reaffirmed its earnings guidance for the full year 2026, with total revenue expected in a range of US$410 million to US$470 million. Source: Company guidance.
Valuation Changes
- Fair Value: Trimmed from $4.75 to $4.25 per share, a reduction of roughly $0.50.
- Discount Rate: Adjusted slightly lower from 9.55% to about 9.29%.
- Revenue Growth: Assumption raised modestly from roughly 24.88% to about 26.14%.
- Net Profit Margin: Tweaked slightly lower from about 4.84% to roughly 4.75%.
- Future P/E: Brought down from about 27.61x to roughly 22.55x, reflecting a lower valuation multiple in the model.
Key Takeaways
- Improved capital efficiency, strategic financing, and technology investments are driving operating leverage, gross margin growth, and positioning for long-term earnings gains.
- Expansion into higher-frequency segments and slower-than-market stall buildout enhances network utilization, supports recurring revenue, and advances market share capture.
- Heavy reliance on government incentives, operational reliability challenges, execution risks, and intensifying competition threaten EVgo's margins, growth prospects, and long-term business model sustainability.
Catalysts
About EVgo- Owns and operates a direct current fast charging network for electric vehicles in the United States.
- EVgo has dramatically lowered its net CapEx per stall (down 28% versus initial 2025 projections) through a combination of improved contractor pricing, material sourcing, use of prefabricated skids, and by capturing more state grants and utility incentives-enabling higher projected returns on capital, improved net margins, and stronger long-term earnings growth.
- Robust industry demand, as evidenced by forecasts showing U.S. electric vehicles in operation set to quadruple by 2030, while the pace of DC fast charging stall buildouts remains more modest, positions EVgo to benefit from an increasing number of EVs per fast charger, resulting in higher utilization rates, revenue per stall, and improved operating leverage.
- Strategic partnerships and expansion into dedicated ultra-fast charging hubs for rideshare, autonomous vehicles, and NACS/Tesla-ready chargers are unlocking new customer segments with high charging frequency and large addressable markets, supporting higher recurring revenue, ancillary revenue growth, and stronger long-term earnings visibility.
- The recently secured $225 million+ commercial bank loan facility (expandable to $300 million) and $1.25 billion DOE loan provide EVgo with flexible, low-cost, non-dilutive capital, enabling accelerated network buildout and stall deployment, increased scale, and the ability to capture market share and operating efficiencies – all reinforcing EBITDA and earnings growth.
- Ongoing investment in proprietary software, AI-driven customer acquisition/retention, dynamic pricing, and next-gen vertically integrated charging architecture is driving both higher customer satisfaction (e.g., increased throughput, 95%+ success rates) and operating efficiencies, supporting gross margin expansion and further EBITDA improvement over time.
EVgo Future Earnings and Revenue Growth
Assumptions
How have these above catalysts been quantified?
- Analysts are assuming EVgo's revenue will grow by 26.1% annually over the next 3 years.
- Analysts are not forecasting that EVgo will become profitable in next 3 years. To represent the Analyst Price Target as a Future PE Valuation we will estimate EVgo's profit margin will increase from -11.1% to the average US Specialty Retail industry of 4.7% in 3 years.
- If EVgo's profit margin were to converge on the industry average, you could expect earnings to reach $39.9 million (and earnings per share of $0.25) by about June 2029, up from -$46.4 million today.
- In order for the above numbers to justify the price target of the analysts, the company would need to trade at a PE ratio of 22.5x on those 2029 earnings, up from -6.1x today. This future PE is greater than the current PE for the US Specialty Retail industry at 21.1x.
- Analysts expect the number of shares outstanding to grow by 4.73% per year for the next 3 years.
- To value all of this in today's terms, we will use a discount rate of 9.29%, as per the Simply Wall St company report.
Risks
What could happen that would invalidate this narrative?- Continued reliance on substantial government grants, state incentives, and federal programs for capital offsets exposes EVgo to regulatory risk-should these incentives be reduced or discontinued, future stall build economics and project returns could rapidly deteriorate, pressuring margins and net earnings.
- Ongoing industry-wide hardware and software issues, as evidenced by the recent costly firmware and legacy charger maintenance event, highlight operational reliability risks and may result in elevated maintenance expenses or reputational drag, reducing gross margin and customer retention in the long term.
- The company's aggressive build schedule, with much of the growth and capital deployment back-half weighted toward 2028–2029, creates significant execution risk; any delays, supply chain bottlenecks, or permitting hurdles could prevent full realization of projected revenue and cash flow targets, constraining long-term EBITDA growth.
- Increased competition from better-capitalized companies, especially as larger players enter the DCFC market with competing networks or as vertically integrated automakers (e.g., Tesla) continue to innovate, could compress utilization rates or provoke price wars, directly impacting revenue growth and sustained market share.
- The business model's long-term viability is tied to sustained growth in public fast charging demand; secular threats such as higher EV battery ranges, improved battery technology, increased adoption of at-home charging, and potential new charging paradigms (like battery swapping or utility-driven integrations) could dampen utilization, capping revenue per stall and challenging overall top-line growth.
Valuation
How have all the factors above been brought together to estimate a fair value?
- The analysts have a consensus price target of $4.25 for EVgo based on their expectations of its future earnings growth, profit margins and other risk factors.
- However, there is a degree of disagreement amongst analysts, with the most bullish reporting a price target of $7.0, and the most bearish reporting a price target of just $3.0.
- In order for you to agree with the analysts, you'd need to believe that by 2029, revenues will be $839.6 million, earnings will come to $39.9 million, and it would be trading on a PE ratio of 22.5x, assuming you use a discount rate of 9.3%.
- Given the current share price of $2.0, the analyst price target of $4.25 is 52.9% higher.
- We always encourage you to reach your own conclusions though. So sense check these analyst numbers against your own assumptions and expectations based on your understanding of the business and what you believe is probable.
Have other thoughts on EVgo?
Create your own narrative on this stock, and estimate its Fair Value using our Valuator tool.
Create NarrativeHow well do narratives help inform your perspective?
Disclaimer
AnalystConsensusTarget is a tool utilizing a Large Language Model (LLM) that ingests data on consensus price targets, forecasted revenue and earnings figures, as well as the transcripts of earnings calls to produce qualitative analysis. The narratives produced by AnalystConsensusTarget are general in nature and are based solely on analyst data and publicly-available material published by the respective companies. These scenarios are not indicative of the company's future performance and are exploratory in nature. Simply Wall St has no position in the company(s) mentioned. Simply Wall St may provide the securities issuer or related entities with website advertising services for a fee, on an arm's length basis. These relationships have no impact on the way we conduct our business, the content we host, or how our content is served to users. The price targets and estimates used are consensus data, and do not constitute a recommendation to buy or sell any stock, and they do not take account of your objectives, or your financial situation. Note that AnalystConsensusTarget's analysis may not factor in the latest price-sensitive company announcements or qualitative material.
