- South Africa
- /
- Metals and Mining
- /
- JSE:SSW
Sibanye Stillwater (JSE:SSW) jumps 6.1% this week, though earnings growth is still tracking behind five-year shareholder returns


Sibanye Stillwater Limited (JSE:SSW) shareholders might be concerned after seeing the share price drop 20% in the last quarter. But that doesn't change the fact that shareholders have received really good returns over the last five years. We think most investors would be happy with the 168% return, over that period. We think it's more important to dwell on the long term returns than the short term returns. The more important question is whether the stock is too cheap or too expensive today. While the long term returns are impressive, we do have some sympathy for those who bought more recently, given the 46% drop, in the last year.
After a strong gain in the past week, it's worth seeing if longer term returns have been driven by improving fundamentals.
See our latest analysis for Sibanye Stillwater
There is no denying that markets are sometimes efficient, but prices do not always reflect underlying business performance. One way to examine how market sentiment has changed over time is to look at the interaction between a company's share price and its earnings per share (EPS).
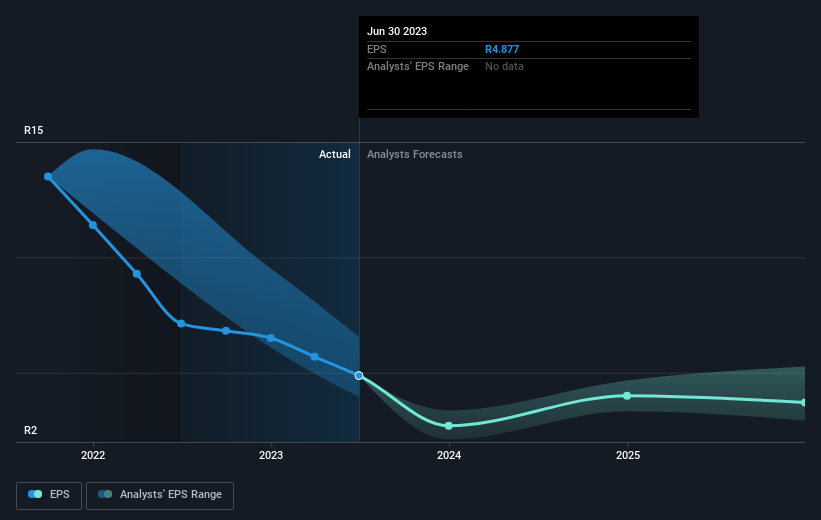
Over half a decade, Sibanye Stillwater managed to grow its earnings per share at 91% a year. This EPS growth is higher than the 22% average annual increase in the share price. So it seems the market isn't so enthusiastic about the stock these days. The reasonably low P/E ratio of 4.82 also suggests market apprehension.
You can see below how EPS has changed over time (discover the exact values by clicking on the image).
We consider it positive that insiders have made significant purchases in the last year. Having said that, most people consider earnings and revenue growth trends to be a more meaningful guide to the business. Dive deeper into the earnings by checking this interactive graph of Sibanye Stillwater's earnings, revenue and cash flow.
What About Dividends?
When looking at investment returns, it is important to consider the difference between total shareholder return (TSR) and share price return. Whereas the share price return only reflects the change in the share price, the TSR includes the value of dividends (assuming they were reinvested) and the benefit of any discounted capital raising or spin-off. It's fair to say that the TSR gives a more complete picture for stocks that pay a dividend. We note that for Sibanye Stillwater the TSR over the last 5 years was 237%, which is better than the share price return mentioned above. This is largely a result of its dividend payments!
A Different Perspective
Investors in Sibanye Stillwater had a tough year, with a total loss of 43% (including dividends), against a market gain of about 0.1%. Even the share prices of good stocks drop sometimes, but we want to see improvements in the fundamental metrics of a business, before getting too interested. On the bright side, long term shareholders have made money, with a gain of 28% per year over half a decade. If the fundamental data continues to indicate long term sustainable growth, the current sell-off could be an opportunity worth considering. It's always interesting to track share price performance over the longer term. But to understand Sibanye Stillwater better, we need to consider many other factors. Take risks, for example - Sibanye Stillwater has 3 warning signs (and 1 which is potentially serious) we think you should know about.
There are plenty of other companies that have insiders buying up shares. You probably do not want to miss this free list of growing companies that insiders are buying.
Please note, the market returns quoted in this article reflect the market weighted average returns of stocks that currently trade on South African exchanges.
New: Manage All Your Stock Portfolios in One Place
We've created the ultimate portfolio companion for stock investors, and it's free.
• Connect an unlimited number of Portfolios and see your total in one currency
• Be alerted to new Warning Signs or Risks via email or mobile
• Track the Fair Value of your stocks
Have feedback on this article? Concerned about the content? Get in touch with us directly. Alternatively, email editorial-team (at) simplywallst.com.
This article by Simply Wall St is general in nature. We provide commentary based on historical data and analyst forecasts only using an unbiased methodology and our articles are not intended to be financial advice. It does not constitute a recommendation to buy or sell any stock, and does not take account of your objectives, or your financial situation. We aim to bring you long-term focused analysis driven by fundamental data. Note that our analysis may not factor in the latest price-sensitive company announcements or qualitative material. Simply Wall St has no position in any stocks mentioned.
About JSE:SSW
Sibanye Stillwater
Operates as a precious metals mining company in South Africa, the United States, Europe, and Australia.
Good value with moderate growth potential.
Similar Companies
Market Insights

Community Narratives

