
Advertisement
Howard Marks put it nicely when he said that, rather than worrying about share price volatility, 'The possibility of permanent loss is the risk I worry about... and every practical investor I know worries about.' When we think about how risky a company is, we always like to look at its use of debt, since debt overload can lead to ruin. As with many other companies Gemfields Group Limited (JSE:GML) makes use of debt. But the real question is whether this debt is making the company risky.
When Is Debt A Problem?
Debt and other liabilities become risky for a business when it cannot easily fulfill those obligations, either with free cash flow or by raising capital at an attractive price. If things get really bad, the lenders can take control of the business. However, a more usual (but still expensive) situation is where a company must dilute shareholders at a cheap share price simply to get debt under control. Having said that, the most common situation is where a company manages its debt reasonably well - and to its own advantage. When we think about a company's use of debt, we first look at cash and debt together.
What Is Gemfields Group's Net Debt?
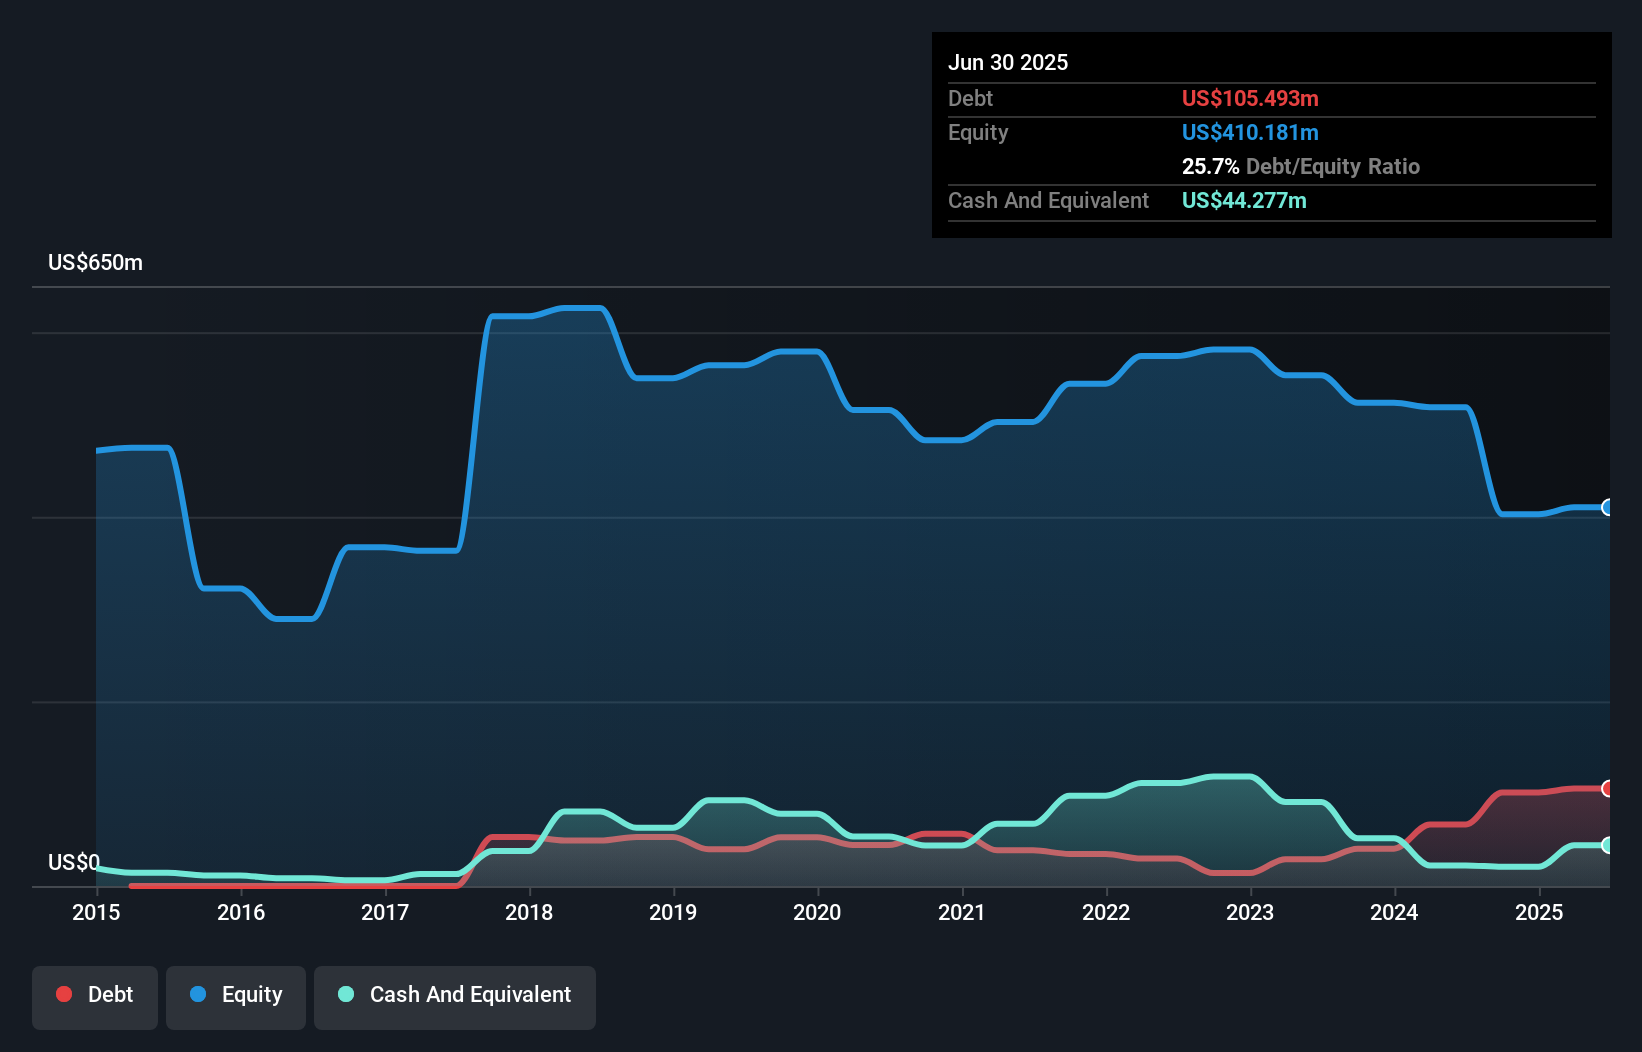
You can click the graphic below for the historical numbers, but it shows that as of June 2025 Gemfields Group had US$105.5m of debt, an increase on US$66.7m, over one year. On the flip side, it has US$44.3m in cash leading to net debt of about US$61.2m.
How Healthy Is Gemfields Group's Balance Sheet?
Zooming in on the latest balance sheet data, we can see that Gemfields Group had liabilities of US$95.9m due within 12 months and liabilities of US$110.3m due beyond that. Offsetting these obligations, it had cash of US$44.3m as well as receivables valued at US$54.4m due within 12 months. So its liabilities outweigh the sum of its cash and (near-term) receivables by US$107.5m.
This deficit is considerable relative to its market capitalization of US$135.1m, so it does suggest shareholders should keep an eye on Gemfields Group's use of debt. This suggests shareholders would be heavily diluted if the company needed to shore up its balance sheet in a hurry. When analysing debt levels, the balance sheet is the obvious place to start. But ultimately the future profitability of the business will decide if Gemfields Group can strengthen its balance sheet over time. So if you want to see what the professionals think, you might find this free report on analyst profit forecasts to be interesting.
See our latest analysis for Gemfields Group
Over 12 months, Gemfields Group made a loss at the EBIT level, and saw its revenue drop to US$156m, which is a fall of 32%. That makes us nervous, to say the least.
Caveat Emptor
Not only did Gemfields Group's revenue slip over the last twelve months, but it also produced negative earnings before interest and tax (EBIT). Its EBIT loss was a whopping US$140m. Considering that alongside the liabilities mentioned above does not give us much confidence that company should be using so much debt. Quite frankly we think the balance sheet is far from match-fit, although it could be improved with time. Another cause for caution is that is bled US$38m in negative free cash flow over the last twelve months. So suffice it to say we consider the stock very risky. There's no doubt that we learn most about debt from the balance sheet. However, not all investment risk resides within the balance sheet - far from it. For instance, we've identified 3 warning signs for Gemfields Group that you should be aware of.
Of course, if you're the type of investor who prefers buying stocks without the burden of debt, then don't hesitate to discover our exclusive list of net cash growth stocks, today.
New: Manage All Your Stock Portfolios in One Place
We've created the ultimate portfolio companion for stock investors, and it's free.
• Connect an unlimited number of Portfolios and see your total in one currency
• Be alerted to new Warning Signs or Risks via email or mobile
• Track the Fair Value of your stocks
Have feedback on this article? Concerned about the content? Get in touch with us directly. Alternatively, email editorial-team (at) simplywallst.com.
This article by Simply Wall St is general in nature. We provide commentary based on historical data and analyst forecasts only using an unbiased methodology and our articles are not intended to be financial advice. It does not constitute a recommendation to buy or sell any stock, and does not take account of your objectives, or your financial situation. We aim to bring you long-term focused analysis driven by fundamental data. Note that our analysis may not factor in the latest price-sensitive company announcements or qualitative material. Simply Wall St has no position in any stocks mentioned.
About JSE:GML
Undervalued with adequate balance sheet.
Market Insights

Advertisement
Weekly Picks
FA

FAI on Arabian Internet and Communication Services ·
Solutions by stc: 34% Upside in Saudi's Digital Transformation Leader
Fair Value:ر.س342.2335.3% undervalued
9 followersusers have followed this narrative
1 commentusers have commented on this narrative
3 likesusers have liked this narrative
RO


RobertoAllende on NVIDIA ·
The AI Infrastructure Giant Grows Into Its Valuation
Fair Value:US$345.0747.9% undervalued
27 followersusers have followed this narrative
28 commentsusers have commented on this narrative
21 likesusers have liked this narrative
Recently Updated Narratives
HA

Haha94 on Perdana Petroleum Berhad ·
Perdana Petroleum Berhad is a Zombie Business with a 27.34% Profit Margin and inflation adjusted revenue Business
Fair Value:RM 0.2128.6% undervalued
1 followerusers have followed this narrative
0 commentsusers have commented on this narrative
0 likesusers have liked this narrative
AB
Abc on Global X Etfs Icav - Global X Silver Miners Ucits ETF ·
Many trends acting at the same time
Fair Value:€10068.5% undervalued
1 followerusers have followed this narrative
0 commentsusers have commented on this narrative
0 likesusers have liked this narrative
NI


niteco on Texas Instruments ·
Engineered for Stability. Positioned for Growth.
Fair Value:US$314.4446.5% undervalued
2 followersusers have followed this narrative
0 commentsusers have commented on this narrative
0 likesusers have liked this narrative
Popular Narratives
TH

TheWallstreetKing on MicroVision ·
MicroVision will explode future revenue by 380.37% with a vision towards success
Fair Value:US$6098.6% undervalued
109 followersusers have followed this narrative
11 commentsusers have commented on this narrative
22 likesusers have liked this narrative
AN

AnalystConsensusTarget on NVIDIA ·
NVDA: Expanding AI Demand Will Drive Major Data Center Investments Through 2026
Fair Value:US$250.3928.1% undervalued
941 followersusers have followed this narrative
6 commentsusers have commented on this narrative
24 likesusers have liked this narrative
OS


oscargarcia on Alphabet ·
The company that turned a verb into a global necessity and basically runs the modern internet, digital ads, smartphones, maps, and AI.
Fair Value:US$3407.4% undervalued
145 followersusers have followed this narrative
6 commentsusers have commented on this narrative
18 likesusers have liked this narrative