Stock Analysis
- South Africa
- /
- Insurance
- /
- JSE:SNT
Santam's (JSE:SNT) three-year total shareholder returns outpace the underlying earnings growth


It hasn't been the best quarter for Santam Ltd (JSE:SNT) shareholders, since the share price has fallen 10% in that time. But at least the stock is up over the last three years. However, it's unlikely many shareholders are elated with the share price gain of 11% over that time, given the rising market.
In light of the stock dropping 3.4% in the past week, we want to investigate the longer term story, and see if fundamentals have been the driver of the company's positive three-year return.
Check out our latest analysis for Santam
To quote Buffett, 'Ships will sail around the world but the Flat Earth Society will flourish. There will continue to be wide discrepancies between price and value in the marketplace...' One way to examine how market sentiment has changed over time is to look at the interaction between a company's share price and its earnings per share (EPS).
Santam was able to grow its EPS at 33% per year over three years, sending the share price higher. The average annual share price increase of 4% is actually lower than the EPS growth. So it seems investors have become more cautious about the company, over time. This cautious sentiment is reflected in its (fairly low) P/E ratio of 11.56.
You can see below how EPS has changed over time (discover the exact values by clicking on the image).
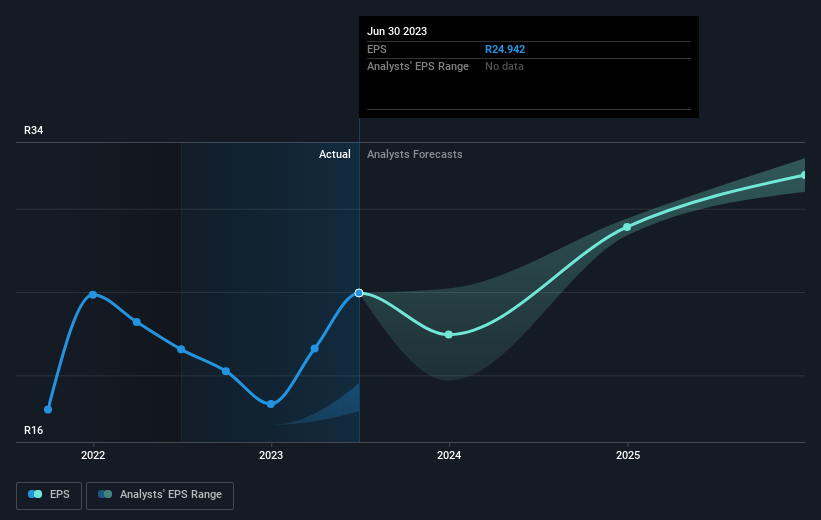
We know that Santam has improved its bottom line over the last three years, but what does the future have in store? It might be well worthwhile taking a look at our free report on how its financial position has changed over time.
What About Dividends?
When looking at investment returns, it is important to consider the difference between total shareholder return (TSR) and share price return. The TSR is a return calculation that accounts for the value of cash dividends (assuming that any dividend received was reinvested) and the calculated value of any discounted capital raisings and spin-offs. So for companies that pay a generous dividend, the TSR is often a lot higher than the share price return. We note that for Santam the TSR over the last 3 years was 36%, which is better than the share price return mentioned above. And there's no prize for guessing that the dividend payments largely explain the divergence!
A Different Perspective
We're pleased to report that Santam shareholders have received a total shareholder return of 20% over one year. Of course, that includes the dividend. That's better than the annualised return of 3% over half a decade, implying that the company is doing better recently. Someone with an optimistic perspective could view the recent improvement in TSR as indicating that the business itself is getting better with time. It's always interesting to track share price performance over the longer term. But to understand Santam better, we need to consider many other factors. Case in point: We've spotted 1 warning sign for Santam you should be aware of.
But note: Santam may not be the best stock to buy. So take a peek at this free list of interesting companies with past earnings growth (and further growth forecast).
Please note, the market returns quoted in this article reflect the market weighted average returns of stocks that currently trade on South African exchanges.
New: Manage All Your Stock Portfolios in One Place
We've created the ultimate portfolio companion for stock investors, and it's free.
• Connect an unlimited number of Portfolios and see your total in one currency
• Be alerted to new Warning Signs or Risks via email or mobile
• Track the Fair Value of your stocks
Have feedback on this article? Concerned about the content? Get in touch with us directly. Alternatively, email editorial-team (at) simplywallst.com.
This article by Simply Wall St is general in nature. We provide commentary based on historical data and analyst forecasts only using an unbiased methodology and our articles are not intended to be financial advice. It does not constitute a recommendation to buy or sell any stock, and does not take account of your objectives, or your financial situation. We aim to bring you long-term focused analysis driven by fundamental data. Note that our analysis may not factor in the latest price-sensitive company announcements or qualitative material. Simply Wall St has no position in any stocks mentioned.
About JSE:SNT
Santam
Provides various general insurance products for individuals and businesses in South Africa, rest of Africa, Southeast Asia, India, the Middle East, and internationally.
Outstanding track record with mediocre balance sheet.
