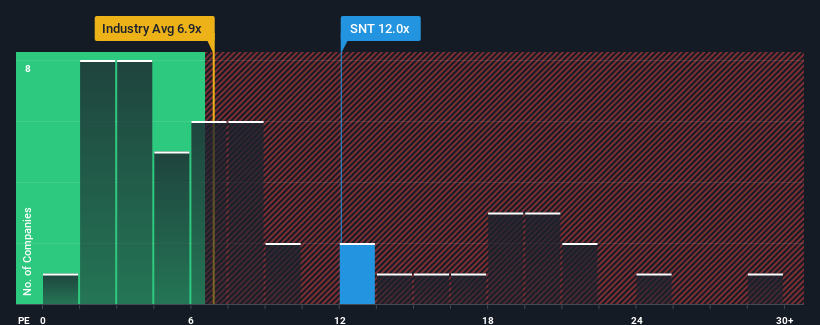
Santam Ltd's (JSE:SNT) price-to-earnings (or "P/E") ratio of 12x might make it look like a sell right now compared to the market in South Africa, where around half of the companies have P/E ratios below 9x and even P/E's below 5x are quite common. However, the P/E might be high for a reason and it requires further investigation to determine if it's justified.
Santam certainly has been doing a good job lately as it's been growing earnings more than most other companies. The P/E is probably high because investors think this strong earnings performance will continue. You'd really hope so, otherwise you're paying a pretty hefty price for no particular reason.
Check out our latest analysis for Santam

Is There Enough Growth For Santam?
The only time you'd be truly comfortable seeing a P/E as high as Santam's is when the company's growth is on track to outshine the market.
If we review the last year of earnings growth, the company posted a terrific increase of 16%. The strong recent performance means it was also able to grow EPS by 136% in total over the last three years. So we can start by confirming that the company has done a great job of growing earnings over that time.
Turning to the outlook, the next three years should generate growth of 8.7% each year as estimated by the three analysts watching the company. Meanwhile, the rest of the market is forecast to expand by 13% per annum, which is noticeably more attractive.
In light of this, it's alarming that Santam's P/E sits above the majority of other companies. Apparently many investors in the company are way more bullish than analysts indicate and aren't willing to let go of their stock at any price. There's a good chance these shareholders are setting themselves up for future disappointment if the P/E falls to levels more in line with the growth outlook.
The Final Word
While the price-to-earnings ratio shouldn't be the defining factor in whether you buy a stock or not, it's quite a capable barometer of earnings expectations.
Our examination of Santam's analyst forecasts revealed that its inferior earnings outlook isn't impacting its high P/E anywhere near as much as we would have predicted. When we see a weak earnings outlook with slower than market growth, we suspect the share price is at risk of declining, sending the high P/E lower. This places shareholders' investments at significant risk and potential investors in danger of paying an excessive premium.
It is also worth noting that we have found 1 warning sign for Santam that you need to take into consideration.
If P/E ratios interest you, you may wish to see this free collection of other companies with strong earnings growth and low P/E ratios.
New: Manage All Your Stock Portfolios in One Place
We've created the ultimate portfolio companion for stock investors, and it's free.
• Connect an unlimited number of Portfolios and see your total in one currency
• Be alerted to new Warning Signs or Risks via email or mobile
• Track the Fair Value of your stocks
Have feedback on this article? Concerned about the content? Get in touch with us directly. Alternatively, email editorial-team (at) simplywallst.com.
This article by Simply Wall St is general in nature. We provide commentary based on historical data and analyst forecasts only using an unbiased methodology and our articles are not intended to be financial advice. It does not constitute a recommendation to buy or sell any stock, and does not take account of your objectives, or your financial situation. We aim to bring you long-term focused analysis driven by fundamental data. Note that our analysis may not factor in the latest price-sensitive company announcements or qualitative material. Simply Wall St has no position in any stocks mentioned.
About JSE:SNT
Santam
Provides various general insurance products for individuals and businesses in South Africa, rest of Africa, Southeast Asia, India, the Middle East, and internationally.
Outstanding track record with adequate balance sheet and pays a dividend.
Similar Companies
Market Insights
Community Narratives


