

Sanlam (JSE:SLM) Full Year 2023 Results
Key Financial Results
- Revenue: R199.0b (up 114% from FY 2022).
- Net income: R11.6b (up 4.0% from FY 2022).
- Profit margin: 5.8% (down from 12% in FY 2022). The decrease in margin was driven by higher expenses.
- EPS: R5.63 (up from R5.44 in FY 2022).
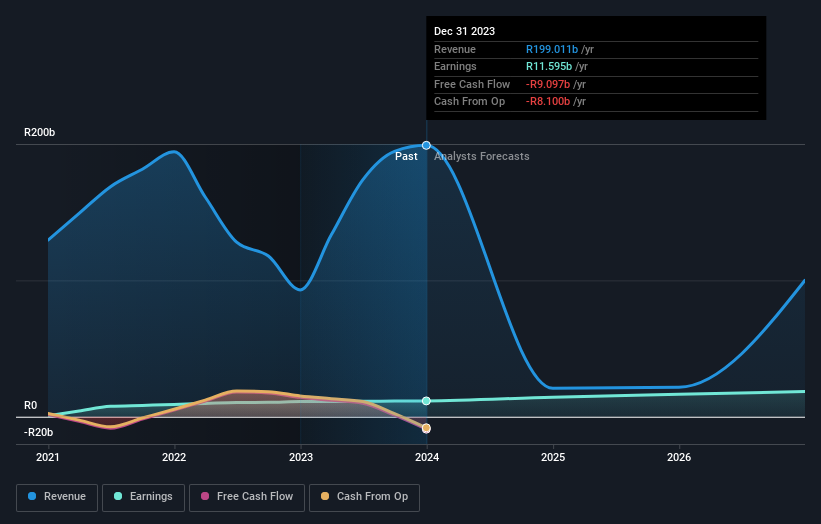
All figures shown in the chart above are for the trailing 12 month (TTM) period
Sanlam Earnings Insights
Looking ahead, revenue is expected to fall by 35% p.a. on average during the next 3 years compared to a 24% decline forecast for the Insurance industry in South Africa.
Performance of the South African Insurance industry.
The company's shares are up 1.7% from a week ago.
Risk Analysis
Before we wrap up, we've discovered 3 warning signs for Sanlam that you should be aware of.
New: Manage All Your Stock Portfolios in One Place
We've created the ultimate portfolio companion for stock investors, and it's free.
• Connect an unlimited number of Portfolios and see your total in one currency
• Be alerted to new Warning Signs or Risks via email or mobile
• Track the Fair Value of your stocks
Have feedback on this article? Concerned about the content? Get in touch with us directly. Alternatively, email editorial-team (at) simplywallst.com.
This article by Simply Wall St is general in nature. We provide commentary based on historical data and analyst forecasts only using an unbiased methodology and our articles are not intended to be financial advice. It does not constitute a recommendation to buy or sell any stock, and does not take account of your objectives, or your financial situation. We aim to bring you long-term focused analysis driven by fundamental data. Note that our analysis may not factor in the latest price-sensitive company announcements or qualitative material. Simply Wall St has no position in any stocks mentioned.
About JSE:SLM
Sanlam
Provides various financial solutions to individual, business, and institutional clients in South Africa, rest of Africa, and internationally.
Proven track record with adequate balance sheet and pays a dividend.
Similar Companies
Market Insights

Community Narratives


