- South Africa
- /
- Insurance
- /
- JSE:SLM
Are Robust Financials Driving The Recent Rally In Sanlam Limited's (JSE:SLM) Stock?


Sanlam (JSE:SLM) has had a great run on the share market with its stock up by a significant 18% over the last three months. Since the market usually pay for a company’s long-term fundamentals, we decided to study the company’s key performance indicators to see if they could be influencing the market. Particularly, we will be paying attention to Sanlam's ROE today.
Return on Equity or ROE is a test of how effectively a company is growing its value and managing investors’ money. In other words, it is a profitability ratio which measures the rate of return on the capital provided by the company's shareholders.
View our latest analysis for Sanlam
How Do You Calculate Return On Equity?
The formula for return on equity is:
Return on Equity = Net Profit (from continuing operations) ÷ Shareholders' Equity
So, based on the above formula, the ROE for Sanlam is:
20% = R19b ÷ R98b (Based on the trailing twelve months to June 2024).
The 'return' refers to a company's earnings over the last year. So, this means that for every ZAR1 of its shareholder's investments, the company generates a profit of ZAR0.20.
What Has ROE Got To Do With Earnings Growth?
We have already established that ROE serves as an efficient profit-generating gauge for a company's future earnings. Based on how much of its profits the company chooses to reinvest or "retain", we are then able to evaluate a company's future ability to generate profits. Assuming all else is equal, companies that have both a higher return on equity and higher profit retention are usually the ones that have a higher growth rate when compared to companies that don't have the same features.
A Side By Side comparison of Sanlam's Earnings Growth And 20% ROE
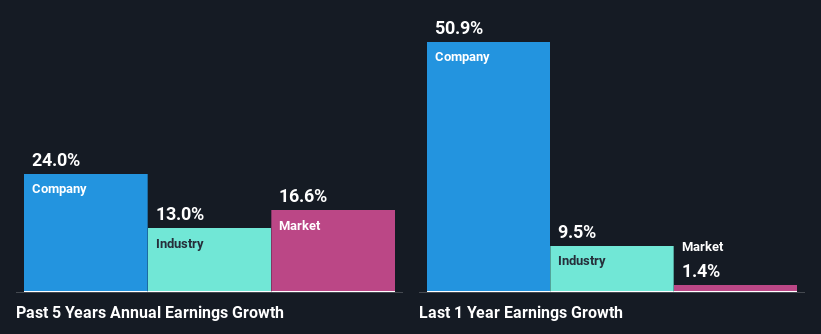
To start with, Sanlam's ROE looks acceptable. Especially when compared to the industry average of 15% the company's ROE looks pretty impressive. This certainly adds some context to Sanlam's exceptional 24% net income growth seen over the past five years. However, there could also be other causes behind this growth. Such as - high earnings retention or an efficient management in place.
As a next step, we compared Sanlam's net income growth with the industry, and pleasingly, we found that the growth seen by the company is higher than the average industry growth of 13%.
Earnings growth is an important metric to consider when valuing a stock. The investor should try to establish if the expected growth or decline in earnings, whichever the case may be, is priced in. Doing so will help them establish if the stock's future looks promising or ominous. Is Sanlam fairly valued compared to other companies? These 3 valuation measures might help you decide.
Is Sanlam Using Its Retained Earnings Effectively?
Sanlam has a significant three-year median payout ratio of 66%, meaning the company only retains 34% of its income. This implies that the company has been able to achieve high earnings growth despite returning most of its profits to shareholders.
Moreover, Sanlam is determined to keep sharing its profits with shareholders which we infer from its long history of paying a dividend for at least ten years. Our latest analyst data shows that the future payout ratio of the company over the next three years is expected to be approximately 61%. Accordingly, forecasts suggest that Sanlam's future ROE will be 17% which is again, similar to the current ROE.
Conclusion
Overall, we are quite pleased with Sanlam's performance. In particular, its high ROE is quite noteworthy and also the probable explanation behind its considerable earnings growth. Yet, the company is retaining a small portion of its profits. Which means that the company has been able to grow its earnings in spite of it, so that's not too bad. That being so, a study of the latest analyst forecasts show that the company is expected to see a slowdown in its future earnings growth. Are these analysts expectations based on the broad expectations for the industry, or on the company's fundamentals? Click here to be taken to our analyst's forecasts page for the company.
New: Manage All Your Stock Portfolios in One Place
We've created the ultimate portfolio companion for stock investors, and it's free.
• Connect an unlimited number of Portfolios and see your total in one currency
• Be alerted to new Warning Signs or Risks via email or mobile
• Track the Fair Value of your stocks
Have feedback on this article? Concerned about the content? Get in touch with us directly. Alternatively, email editorial-team (at) simplywallst.com.
This article by Simply Wall St is general in nature. We provide commentary based on historical data and analyst forecasts only using an unbiased methodology and our articles are not intended to be financial advice. It does not constitute a recommendation to buy or sell any stock, and does not take account of your objectives, or your financial situation. We aim to bring you long-term focused analysis driven by fundamental data. Note that our analysis may not factor in the latest price-sensitive company announcements or qualitative material. Simply Wall St has no position in any stocks mentioned.
About JSE:SLM
Sanlam
Provides various financial solutions to individual, business, and institutional clients in South Africa, rest of Africa, and internationally.
Proven track record with adequate balance sheet and pays a dividend.
