- South Africa
- /
- Capital Markets
- /
- JSE:INL
Investing in Investec Group (JSE:INL) three years ago would have delivered you a 244% gain


The most you can lose on any stock (assuming you don't use leverage) is 100% of your money. But if you buy shares in a really great company, you can more than double your money. For instance the Investec Group (JSE:INL) share price is 186% higher than it was three years ago. Most would be happy with that. It's down 1.7% in the last seven days.
So let's assess the underlying fundamentals over the last 3 years and see if they've moved in lock-step with shareholder returns.
View our latest analysis for Investec Group
To quote Buffett, 'Ships will sail around the world but the Flat Earth Society will flourish. There will continue to be wide discrepancies between price and value in the marketplace...' One flawed but reasonable way to assess how sentiment around a company has changed is to compare the earnings per share (EPS) with the share price.
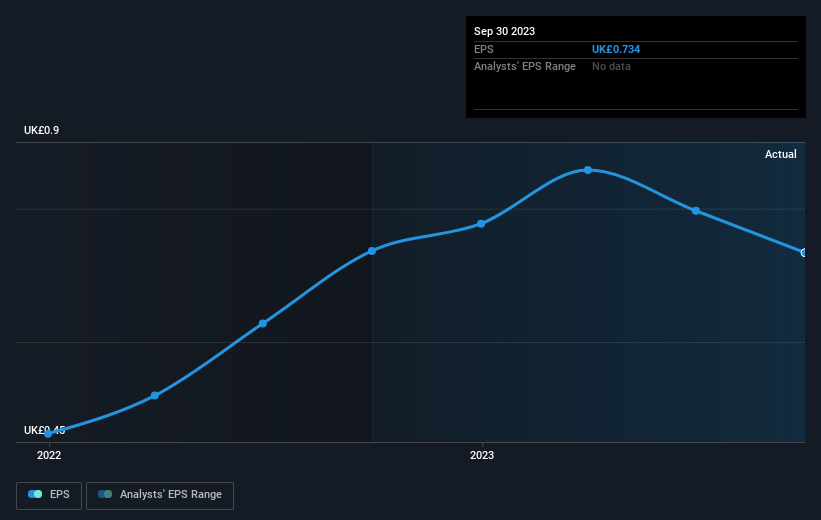
Investec Group was able to grow its EPS at 107% per year over three years, sending the share price higher. The average annual share price increase of 42% is actually lower than the EPS growth. So it seems investors have become more cautious about the company, over time. This cautious sentiment is reflected in its (fairly low) P/E ratio of 6.90.
The graphic below depicts how EPS has changed over time (unveil the exact values by clicking on the image).
It is of course excellent to see how Investec Group has grown profits over the years, but the future is more important for shareholders. Take a more thorough look at Investec Group's financial health with this free report on its balance sheet.
What About Dividends?
As well as measuring the share price return, investors should also consider the total shareholder return (TSR). The TSR is a return calculation that accounts for the value of cash dividends (assuming that any dividend received was reinvested) and the calculated value of any discounted capital raisings and spin-offs. It's fair to say that the TSR gives a more complete picture for stocks that pay a dividend. In the case of Investec Group, it has a TSR of 244% for the last 3 years. That exceeds its share price return that we previously mentioned. This is largely a result of its dividend payments!
A Different Perspective
We're pleased to report that Investec Group shareholders have received a total shareholder return of 27% over one year. Of course, that includes the dividend. Since the one-year TSR is better than the five-year TSR (the latter coming in at 25% per year), it would seem that the stock's performance has improved in recent times. Someone with an optimistic perspective could view the recent improvement in TSR as indicating that the business itself is getting better with time. It's always interesting to track share price performance over the longer term. But to understand Investec Group better, we need to consider many other factors. Consider risks, for instance. Every company has them, and we've spotted 2 warning signs for Investec Group you should know about.
Of course, you might find a fantastic investment by looking elsewhere. So take a peek at this free list of companies we expect will grow earnings.
Please note, the market returns quoted in this article reflect the market weighted average returns of stocks that currently trade on South African exchanges.
New: AI Stock Screener & Alerts
Our new AI Stock Screener scans the market every day to uncover opportunities.
• Dividend Powerhouses (3%+ Yield)
• Undervalued Small Caps with Insider Buying
• High growth Tech and AI Companies
Or build your own from over 50 metrics.
Have feedback on this article? Concerned about the content? Get in touch with us directly. Alternatively, email editorial-team (at) simplywallst.com.
This article by Simply Wall St is general in nature. We provide commentary based on historical data and analyst forecasts only using an unbiased methodology and our articles are not intended to be financial advice. It does not constitute a recommendation to buy or sell any stock, and does not take account of your objectives, or your financial situation. We aim to bring you long-term focused analysis driven by fundamental data. Note that our analysis may not factor in the latest price-sensitive company announcements or qualitative material. Simply Wall St has no position in any stocks mentioned.
About JSE:INL
Investec Group
Engages in the provision of various financial products and services in South Africa, the United Kingdom, and internationally.
Adequate balance sheet average dividend payer.

