
Advertisement
- United States
- /
- Gas Utilities
- /
- NYSE:NFG
Is National Fuel Gas Company (NYSE:NFG) Worth US$61.0 Based On Its Intrinsic Value?
Key Insights
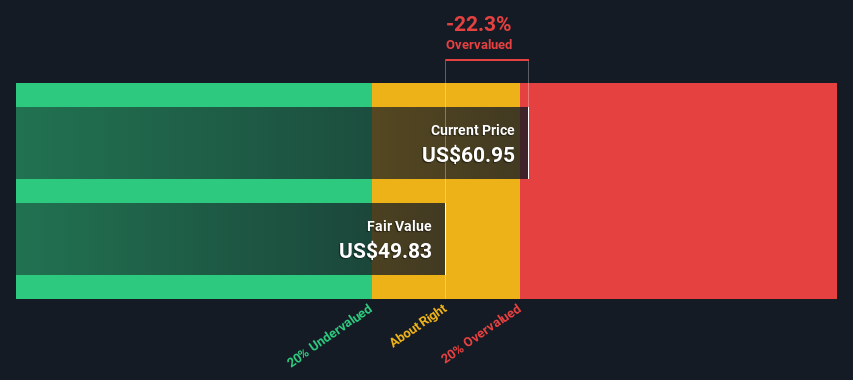
- National Fuel Gas' estimated fair value is US$49.83 based on 2 Stage Free Cash Flow to Equity
- National Fuel Gas is estimated to be 22% overvalued based on current share price of US$60.95
- The US$69.00 analyst price target for NFG is 38% more than our estimate of fair value
Today we will run through one way of estimating the intrinsic value of National Fuel Gas Company (NYSE:NFG) by projecting its future cash flows and then discounting them to today's value. One way to achieve this is by employing the Discounted Cash Flow (DCF) model. Models like these may appear beyond the comprehension of a lay person, but they're fairly easy to follow.
Companies can be valued in a lot of ways, so we would point out that a DCF is not perfect for every situation. If you still have some burning questions about this type of valuation, take a look at the Simply Wall St analysis model.
Check out our latest analysis for National Fuel Gas
What's The Estimated Valuation?
We're using the 2-stage growth model, which simply means we take in account two stages of company's growth. In the initial period the company may have a higher growth rate and the second stage is usually assumed to have a stable growth rate. To start off with, we need to estimate the next ten years of cash flows. Where possible we use analyst estimates, but when these aren't available we extrapolate the previous free cash flow (FCF) from the last estimate or reported value. We assume companies with shrinking free cash flow will slow their rate of shrinkage, and that companies with growing free cash flow will see their growth rate slow, over this period. We do this to reflect that growth tends to slow more in the early years than it does in later years.
Generally we assume that a dollar today is more valuable than a dollar in the future, and so the sum of these future cash flows is then discounted to today's value:
10-year free cash flow (FCF) estimate
| 2025 | 2026 | 2027 | 2028 | 2029 | 2030 | 2031 | 2032 | 2033 | 2034 | |
| Levered FCF ($, Millions) | US$189.0m | US$161.0m | US$161.9m | US$163.8m | US$166.3m | US$169.4m | US$172.9m | US$176.6m | US$180.6m | US$184.9m |
| Growth Rate Estimate Source | Analyst x1 | Analyst x1 | Est @ 0.58% | Est @ 1.15% | Est @ 1.56% | Est @ 1.84% | Est @ 2.04% | Est @ 2.18% | Est @ 2.27% | Est @ 2.34% |
| Present Value ($, Millions) Discounted @ 5.8% | US$179 | US$144 | US$137 | US$131 | US$126 | US$121 | US$117 | US$113 | US$109 | US$105 |
("Est" = FCF growth rate estimated by Simply Wall St)
Present Value of 10-year Cash Flow (PVCF) = US$1.3b
After calculating the present value of future cash flows in the initial 10-year period, we need to calculate the Terminal Value, which accounts for all future cash flows beyond the first stage. For a number of reasons a very conservative growth rate is used that cannot exceed that of a country's GDP growth. In this case we have used the 5-year average of the 10-year government bond yield (2.5%) to estimate future growth. In the same way as with the 10-year 'growth' period, we discount future cash flows to today's value, using a cost of equity of 5.8%.
Terminal Value (TV)= FCF2034 × (1 + g) ÷ (r – g) = US$185m× (1 + 2.5%) ÷ (5.8%– 2.5%) = US$5.7b
Present Value of Terminal Value (PVTV)= TV / (1 + r)10= US$5.7b÷ ( 1 + 5.8%)10= US$3.3b
The total value, or equity value, is then the sum of the present value of the future cash flows, which in this case is US$4.6b. To get the intrinsic value per share, we divide this by the total number of shares outstanding. Compared to the current share price of US$61.0, the company appears slightly overvalued at the time of writing. Remember though, that this is just an approximate valuation, and like any complex formula - garbage in, garbage out.
Important Assumptions
Now the most important inputs to a discounted cash flow are the discount rate, and of course, the actual cash flows. Part of investing is coming up with your own evaluation of a company's future performance, so try the calculation yourself and check your own assumptions. The DCF also does not consider the possible cyclicality of an industry, or a company's future capital requirements, so it does not give a full picture of a company's potential performance. Given that we are looking at National Fuel Gas as potential shareholders, the cost of equity is used as the discount rate, rather than the cost of capital (or weighted average cost of capital, WACC) which accounts for debt. In this calculation we've used 5.8%, which is based on a levered beta of 0.800. Beta is a measure of a stock's volatility, compared to the market as a whole. We get our beta from the industry average beta of globally comparable companies, with an imposed limit between 0.8 and 2.0, which is a reasonable range for a stable business.
SWOT Analysis for National Fuel Gas
Strength
- Debt is well covered by earnings and cashflows.
Weakness
- Earnings declined over the past year.
- Dividend is low compared to the top 25% of dividend payers in the Gas Utilities market.
Opportunity
- Annual earnings are forecast to grow faster than the American market.
- Good value based on P/E ratio compared to estimated Fair P/E ratio.
Threat
- Dividends are not covered by cash flow.
- Revenue is forecast to grow slower than 20% per year.
Next Steps:
Although the valuation of a company is important, it ideally won't be the sole piece of analysis you scrutinize for a company. The DCF model is not a perfect stock valuation tool. Instead the best use for a DCF model is to test certain assumptions and theories to see if they would lead to the company being undervalued or overvalued. For instance, if the terminal value growth rate is adjusted slightly, it can dramatically alter the overall result. Can we work out why the company is trading at a premium to intrinsic value? For National Fuel Gas, we've put together three relevant items you should consider:
- Risks: Every company has them, and we've spotted 5 warning signs for National Fuel Gas you should know about.
- Management:Have insiders been ramping up their shares to take advantage of the market's sentiment for NFG's future outlook? Check out our management and board analysis with insights on CEO compensation and governance factors.
- Other High Quality Alternatives: Do you like a good all-rounder? Explore our interactive list of high quality stocks to get an idea of what else is out there you may be missing!
PS. The Simply Wall St app conducts a discounted cash flow valuation for every stock on the NYSE every day. If you want to find the calculation for other stocks just search here.
Valuation is complex, but we're here to simplify it.
Discover if National Fuel Gas might be undervalued or overvalued with our detailed analysis, featuring fair value estimates, potential risks, dividends, insider trades, and its financial condition.
Access Free AnalysisHave feedback on this article? Concerned about the content? Get in touch with us directly. Alternatively, email editorial-team (at) simplywallst.com.
This article by Simply Wall St is general in nature. We provide commentary based on historical data and analyst forecasts only using an unbiased methodology and our articles are not intended to be financial advice. It does not constitute a recommendation to buy or sell any stock, and does not take account of your objectives, or your financial situation. We aim to bring you long-term focused analysis driven by fundamental data. Note that our analysis may not factor in the latest price-sensitive company announcements or qualitative material. Simply Wall St has no position in any stocks mentioned.
About NYSE:NFG
High growth potential slight.
Market Insights

Advertisement
Community Narratives
WhiteCap Is Positioned To Profit Regardless Of Trump's Policy 
Fair Value CA$22.60|61.6% undervalued
ST
Equity Analyst and Writer
Microsoft's Evolution Will Drive Revenue to New Heights Fueled by AI
Fair Value US$360.00|28.3% overvalued
BR
Community Contributor
A CASE FOR USD$2.50 (CAD$3.44) BY 2028 (A 5-10 BAGGER)
Fair Value CA$3.44|87.8% undervalued
AG
Community Contributor