
Advertisement
- United States
- /
- Gas Utilities
- /
- NYSE:MDU
Investors in MDU Resources Group (NYSE:MDU) have seen notable returns of 75% over the past three years

It can certainly be frustrating when a stock does not perform as hoped. But it's hard to avoid some disappointing investments when the overall market is down. The MDU Resources Group, Inc. (NYSE:MDU) is down 39% over three years, but the total shareholder return is 75% once you include the dividend. That's better than the market which returned 23% over the last three years. The falls have accelerated recently, with the share price down 12% in the last three months. But this could be related to the weak market, which is down 16% in the same period.
With that in mind, it's worth seeing if the company's underlying fundamentals have been the driver of long term performance, or if there are some discrepancies.
While markets are a powerful pricing mechanism, share prices reflect investor sentiment, not just underlying business performance. One way to examine how market sentiment has changed over time is to look at the interaction between a company's share price and its earnings per share (EPS).
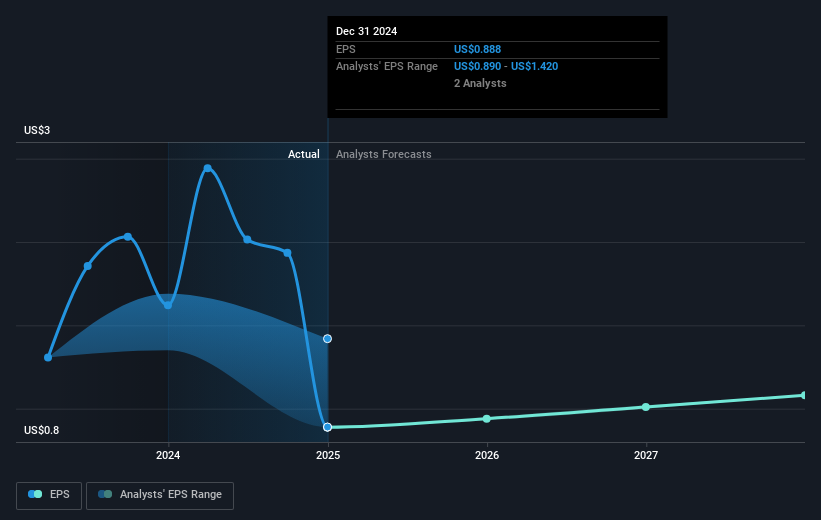
MDU Resources Group saw its EPS decline at a compound rate of 9.6% per year, over the last three years. This reduction in EPS is slower than the 15% annual reduction in the share price. So it's likely that the EPS decline has disappointed the market, leaving investors hesitant to buy.
You can see how EPS has changed over time in the image below (click on the chart to see the exact values).
It's probably worth noting we've seen significant insider buying in the last quarter, which we consider a positive. On the other hand, we think the revenue and earnings trends are much more meaningful measures of the business. Before buying or selling a stock, we always recommend a close examination of historic growth trends, available here..
What About Dividends?
It is important to consider the total shareholder return, as well as the share price return, for any given stock. The TSR incorporates the value of any spin-offs or discounted capital raisings, along with any dividends, based on the assumption that the dividends are reinvested. It's fair to say that the TSR gives a more complete picture for stocks that pay a dividend. We note that for MDU Resources Group the TSR over the last 3 years was 75%, which is better than the share price return mentioned above. The dividends paid by the company have thusly boosted the total shareholder return.
A Different Perspective
It's nice to see that MDU Resources Group shareholders have received a total shareholder return of 26% over the last year. And that does include the dividend. Since the one-year TSR is better than the five-year TSR (the latter coming in at 17% per year), it would seem that the stock's performance has improved in recent times. Given the share price momentum remains strong, it might be worth taking a closer look at the stock, lest you miss an opportunity. It's always interesting to track share price performance over the longer term. But to understand MDU Resources Group better, we need to consider many other factors. To that end, you should learn about the 3 warning signs we've spotted with MDU Resources Group (including 1 which is significant) .
If you like to buy stocks alongside management, then you might just love this free list of companies. (Hint: most of them are flying under the radar).
Please note, the market returns quoted in this article reflect the market weighted average returns of stocks that currently trade on American exchanges.
New: Manage All Your Stock Portfolios in One Place
We've created the ultimate portfolio companion for stock investors, and it's free.
• Connect an unlimited number of Portfolios and see your total in one currency
• Be alerted to new Warning Signs or Risks via email or mobile
• Track the Fair Value of your stocks
Have feedback on this article? Concerned about the content? Get in touch with us directly. Alternatively, email editorial-team (at) simplywallst.com.
This article by Simply Wall St is general in nature. We provide commentary based on historical data and analyst forecasts only using an unbiased methodology and our articles are not intended to be financial advice. It does not constitute a recommendation to buy or sell any stock, and does not take account of your objectives, or your financial situation. We aim to bring you long-term focused analysis driven by fundamental data. Note that our analysis may not factor in the latest price-sensitive company announcements or qualitative material. Simply Wall St has no position in any stocks mentioned.
About NYSE:MDU
MDU Resources Group
Engages in the regulated energy delivery businesses in the United States.
Low and slightly overvalued.
Similar Companies
Market Insights

Advertisement
Community Narratives
The Most Undervalued of the Magnificent 7
Fair Value US$237.43|37.8% undervalued
IN
Community Contributor
CSL is undervalued in High Tax Scenario
Fair Value AU$263.33|10.2% undervalued
RA
Community Contributor
PVA TePla's New Strategy Aims for 22% Revenue Growth in Semiconductor Recovery
Fair Value €19.19|20.8% undervalued
MI
Community Contributor