Advertisement
- United States
- /
- Other Utilities
- /
- NYSE:BIP
Should Investors Take a Fresh Look at Brookfield Infrastructure After Strong 12.6% Monthly Jump?

Simply Wall St
Reviewed by Bailey Pemberton
If you have been watching Brookfield Infrastructure Partners lately, you are not alone. The stock is making some noise, catching the attention of both long-term investors and newcomers deciding whether now is the time to jump in. Over the past week, shares climbed 3.7%, adding to an impressive gain of 12.6% in the last month. If you zoom out even further, the year-to-date return sits at 7.8%, and it has posted a solid 35.3% gain over the past five years. These moves reflect both renewed optimism about global infrastructure demand and subtle shifts in how the market views the company’s risk and growth profile.
What is really interesting about Brookfield Infrastructure Partners is how its valuation shapes up. When we look under the hood using six key valuation checks, the company scores a 5. This means it appears undervalued in five out of six important categories. For investors looking for value in a volatile market, those numbers stand out. There is a case to be made for the stock’s growth potential as market sentiment changes, but there is also a deeper story hidden in these valuation figures.
In the next section, we will dig into how different valuation methods measure Brookfield Infrastructure Partners. Even more importantly, we will explore a unique approach to understanding what the company is truly worth.
Why Brookfield Infrastructure Partners is lagging behind its peers
Approach 1: Brookfield Infrastructure Partners Discounted Cash Flow (DCF) Analysis
The Discounted Cash Flow (DCF) model estimates a company’s intrinsic value by projecting its future cash flows and discounting them back to their value today. This approach is widely used for companies like Brookfield Infrastructure Partners, where future cash generation is a central part of the investment case.
Currently, Brookfield Infrastructure Partners reports free cash flow (FCF) of $743.3 million. Analyst estimates suggest a steep growth trajectory, with FCF expected to reach $5.19 billion by the end of 2029. For reference, projections after the next five years are extrapolated using internal models. The data showcases a strong upward trend, supported by both analyst consensus and forward-looking estimates. All values are denominated in U.S. dollars.
Based on this two-stage free cash flow to equity approach, the DCF model calculates an intrinsic fair value of $179.96 per share. At today’s market prices, this result means the stock is trading at an 80.9% discount. This suggests notable undervaluation based on future cash flow expectations.
Result: UNDERVALUED
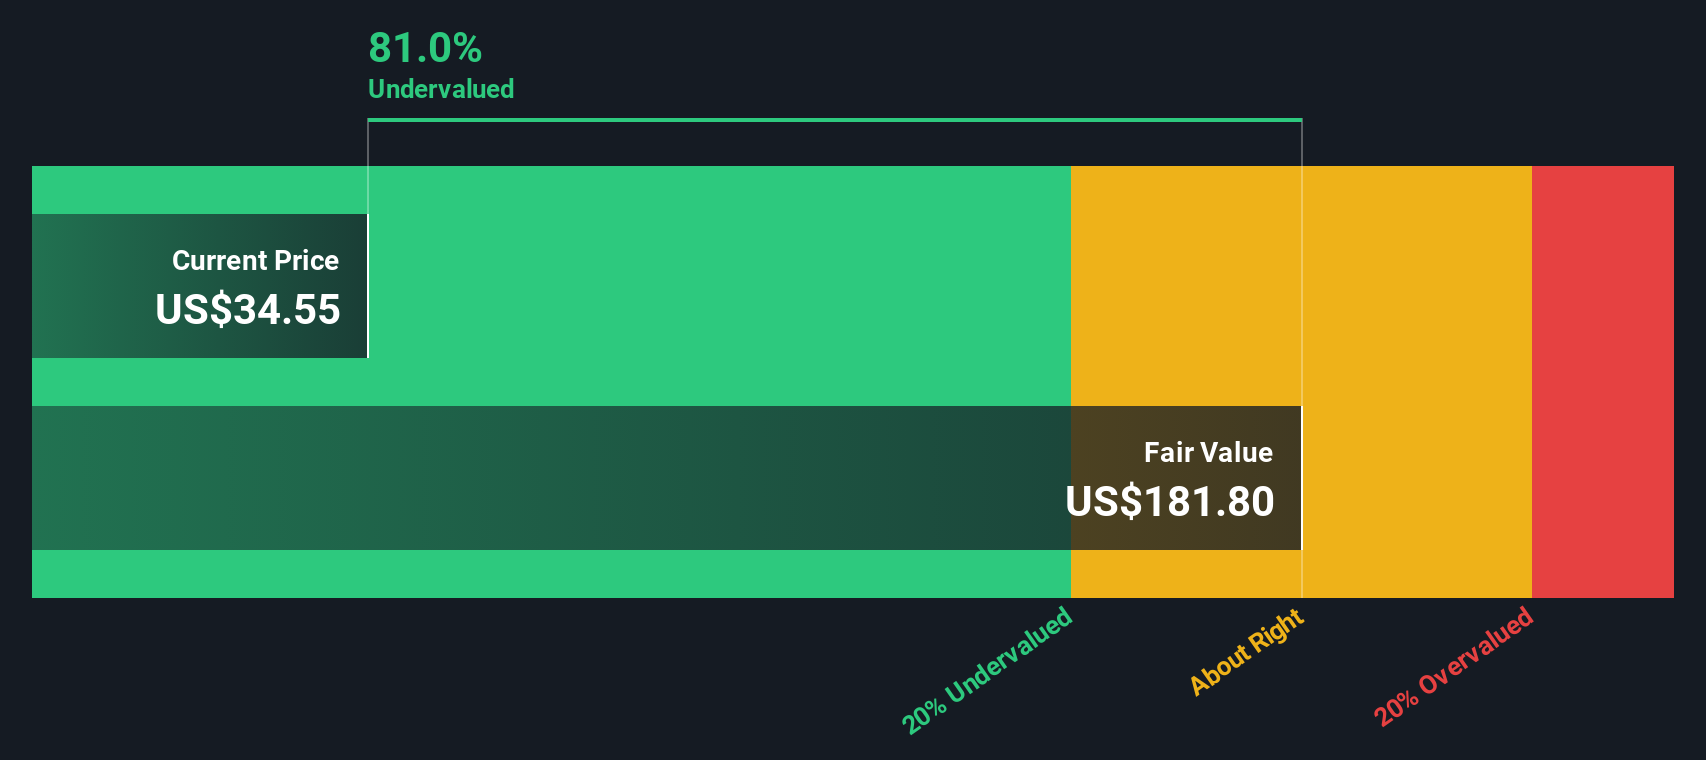
Our Discounted Cash Flow (DCF) analysis suggests Brookfield Infrastructure Partners is undervalued by 80.9%. Track this in your watchlist or portfolio, or discover more undervalued stocks.
Approach 2: Brookfield Infrastructure Partners Price vs Sales
The Price-to-Sales (P/S) ratio is a popular metric for evaluating companies like Brookfield Infrastructure Partners, especially those with consistent revenues but fluctuating earnings due to large capital investments or non-cash charges. For profitable infrastructure firms, P/S can cut through some of this noise and provide a clearer view of the value that the market places on each dollar of revenue.
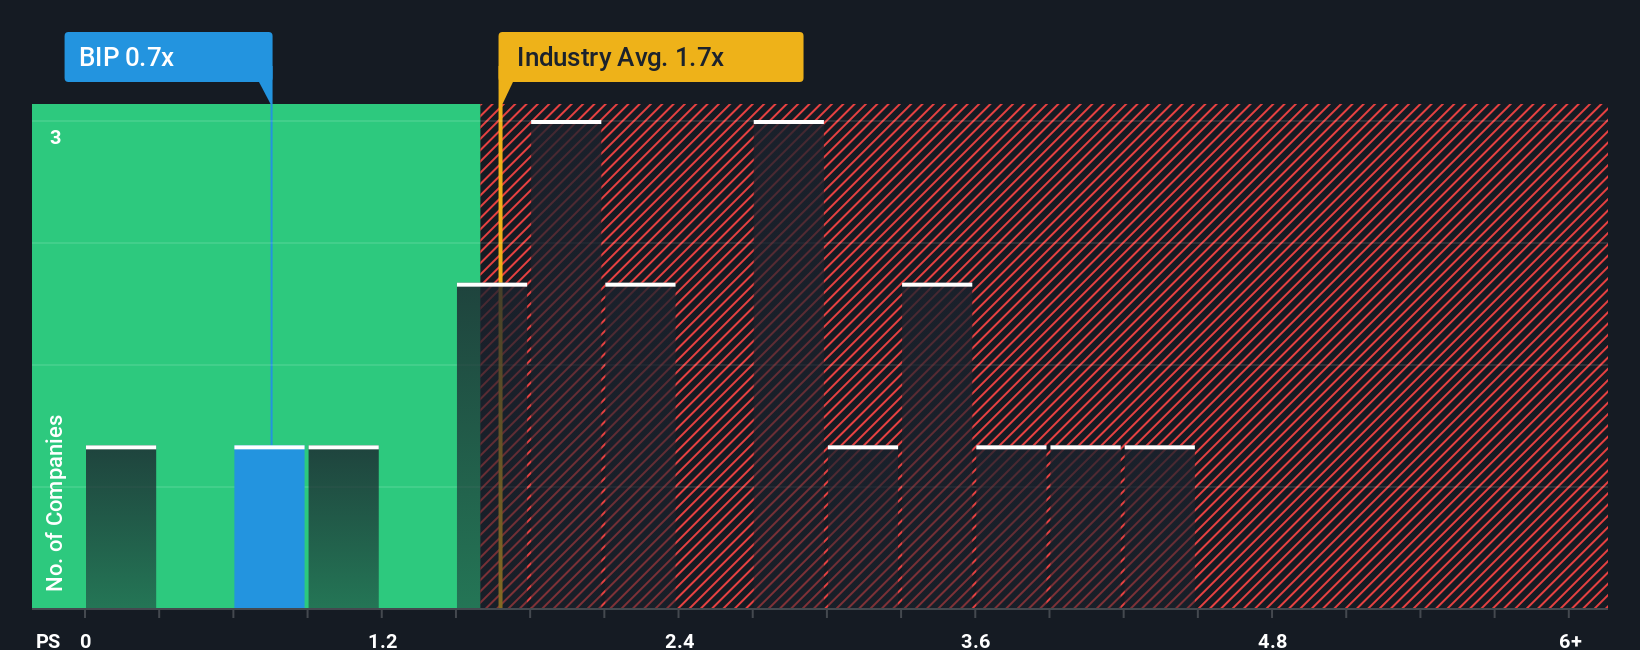
While growth expectations and risk profiles influence what constitutes a “normal” multiple, a higher P/S ratio typically reflects greater investor confidence in a company’s future prospects or a lower perceived risk. Conversely, a lower ratio can signal skepticism or risks that the market has yet to price in. BIP currently trades at a P/S multiple of 0.74x, well below the industry average of 1.68x and lower than the peer average of 3.12x. These figures suggest that the market is discounting Brookfield Infrastructure’s sales compared to similar businesses.
To provide a more customized benchmark, Simply Wall St’s “Fair Ratio” incorporates factors such as expected earnings growth, industry conditions, profit margins, market cap, and business-specific risks. This makes it a more precise yardstick than simple peer or industry averages. For BIP, the Fair Ratio is calculated at 1.17x. Compared to the current P/S of 0.74x, the company’s shares appear undervalued on this basis and could offer an attractive entry point for long-term investors.
Result: UNDERVALUED
PS ratios tell one story, but what if the real opportunity lies elsewhere? Discover companies where insiders are betting big on explosive growth.
Upgrade Your Decision Making: Choose your Brookfield Infrastructure Partners Narrative
Earlier we mentioned there is an even better way to understand valuation, so let's introduce you to Narratives. A Narrative is more than just a forecast or a target price; it's your perspective or story behind what a company is worth, combining your view of Brookfield Infrastructure Partners’ future revenue, profit margins, and risks into a clearly defined fair value estimate.
Narratives connect the dots between the company’s fundamentals, its growth drivers, and where you see its long-term potential, making your investment reasoning transparent and actionable. On Simply Wall St’s Community page, millions of investors use Narratives to easily lay out their assumptions and see how those compare to others, all within an accessible and dynamic format.
The power of Narratives lies in how they update automatically when new events such as earnings results or important news change the outlook, so your reasoning always reflects the latest information. By comparing a Narrative’s fair value to the current share price, you can decide if now is the right time to buy or sell, with clarity about the logic behind each conclusion.
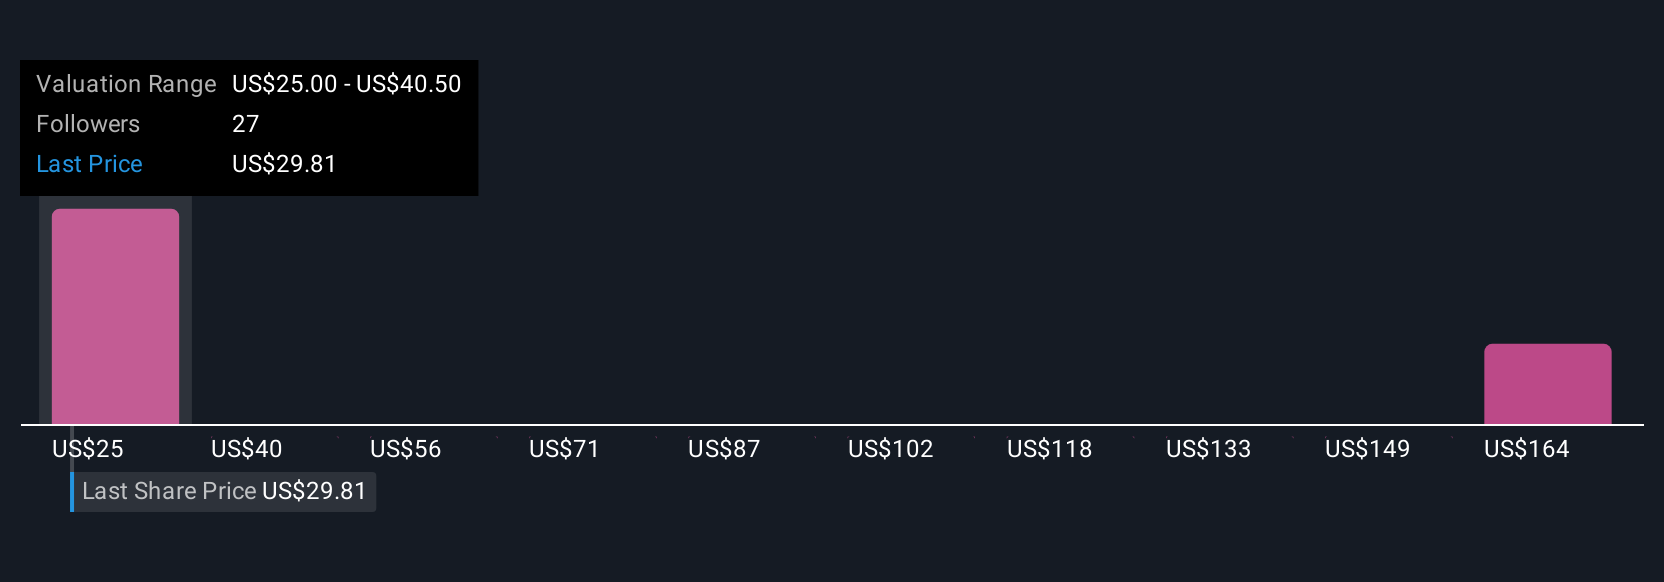
For example, some investors expect Brookfield Infrastructure Partners to excel as global demand for digital infrastructure and clean energy surges, resulting in a highest price target of $53. Others are more cautious, highlighting regulatory or acquisition risks and see fair value as low as $31, so your Narrative helps you confidently chart your own path.
Do you think there's more to the story for Brookfield Infrastructure Partners? Create your own Narrative to let the Community know!
This article by Simply Wall St is general in nature. We provide commentary based on historical data and analyst forecasts only using an unbiased methodology and our articles are not intended to be financial advice. It does not constitute a recommendation to buy or sell any stock, and does not take account of your objectives, or your financial situation. We aim to bring you long-term focused analysis driven by fundamental data. Note that our analysis may not factor in the latest price-sensitive company announcements or qualitative material. Simply Wall St has no position in any stocks mentioned.
Valuation is complex, but we're here to simplify it.
Discover if Brookfield Infrastructure Partners might be undervalued or overvalued with our detailed analysis, featuring fair value estimates, potential risks, dividends, insider trades, and its financial condition.
Access Free AnalysisHave feedback on this article? Concerned about the content? Get in touch with us directly. Alternatively, email editorial-team@simplywallst.com
About NYSE:BIP
Brookfield Infrastructure Partners
Engages in the utilities, transport, midstream, and data businesses.
Undervalued average dividend payer.
Market Insights

Advertisement
Community Narratives
The Next Phase of Energy Storage: How NeoVolta Is Tackling America’s Power Crunch
Fair Value US$7.50|30.4% undervalued
MA
Community Contributor
A formidable player in AI and enterprise computing.
Fair Value US$210.00|3.0% undervalued
CO
Community Contributor
IREN's Bold Moves in Sustainable Bitcoin Mining & AI Data Centers
Fair Value US$72.52|20.4% undervalued
BL
Community Contributor
Cooling the Champions: The Aussie Tech Behind F1's Victories
Fair Value AU$12.40|38.1% undervalued
TR
Community Contributor