- United States
- /
- Transportation
- /
- NYSE:YMM
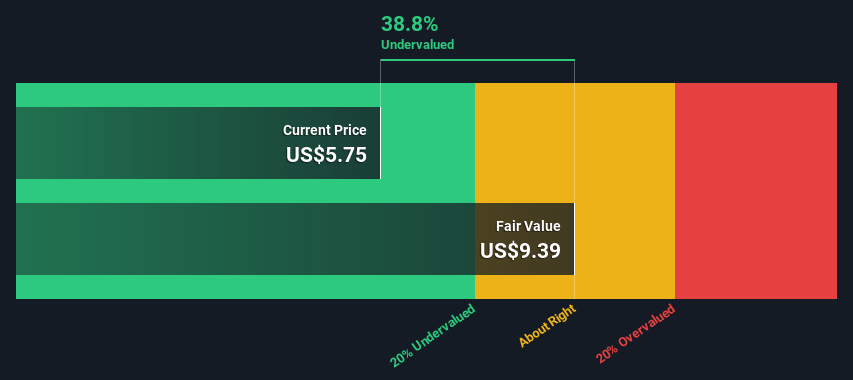
Are Investors Undervaluing Full Truck Alliance Co. Ltd. (NYSE:YMM) By 39%?


Key Insights
- Full Truck Alliance's estimated fair value is US$9.39 based on 2 Stage Free Cash Flow to Equity
- Current share price of US$5.75 suggests Full Truck Alliance is potentially 39% undervalued
- Our fair value estimate is 19% lower than Full Truck Alliance's analyst price target of CN¥11.57
In this article we are going to estimate the intrinsic value of Full Truck Alliance Co. Ltd. (NYSE:YMM) by taking the expected future cash flows and discounting them to today's value. We will use the Discounted Cash Flow (DCF) model on this occasion. Before you think you won't be able to understand it, just read on! It's actually much less complex than you'd imagine.
Remember though, that there are many ways to estimate a company's value, and a DCF is just one method. For those who are keen learners of equity analysis, the Simply Wall St analysis model here may be something of interest to you.
See our latest analysis for Full Truck Alliance
The Model
We are going to use a two-stage DCF model, which, as the name states, takes into account two stages of growth. The first stage is generally a higher growth period which levels off heading towards the terminal value, captured in the second 'steady growth' period. To start off with, we need to estimate the next ten years of cash flows. Where possible we use analyst estimates, but when these aren't available we extrapolate the previous free cash flow (FCF) from the last estimate or reported value. We assume companies with shrinking free cash flow will slow their rate of shrinkage, and that companies with growing free cash flow will see their growth rate slow, over this period. We do this to reflect that growth tends to slow more in the early years than it does in later years.
A DCF is all about the idea that a dollar in the future is less valuable than a dollar today, so we discount the value of these future cash flows to their estimated value in today's dollars:
10-year free cash flow (FCF) estimate
| 2023 | 2024 | 2025 | 2026 | 2027 | 2028 | 2029 | 2030 | 2031 | 2032 | |
| Levered FCF (CN¥, Millions) | CN¥1.35b | CN¥2.77b | CN¥3.76b | CN¥4.22b | CN¥4.86b | CN¥5.34b | CN¥5.73b | CN¥6.07b | CN¥6.35b | CN¥6.60b |
| Growth Rate Estimate Source | Analyst x2 | Analyst x2 | Analyst x2 | Analyst x1 | Analyst x1 | Est @ 9.71% | Est @ 7.43% | Est @ 5.83% | Est @ 4.72% | Est @ 3.93% |
| Present Value (CN¥, Millions) Discounted @ 8.9% | CN¥1.2k | CN¥2.3k | CN¥2.9k | CN¥3.0k | CN¥3.2k | CN¥3.2k | CN¥3.2k | CN¥3.1k | CN¥3.0k | CN¥2.8k |
("Est" = FCF growth rate estimated by Simply Wall St)
Present Value of 10-year Cash Flow (PVCF) = CN¥28b
The second stage is also known as Terminal Value, this is the business's cash flow after the first stage. The Gordon Growth formula is used to calculate Terminal Value at a future annual growth rate equal to the 5-year average of the 10-year government bond yield of 2.1%. We discount the terminal cash flows to today's value at a cost of equity of 8.9%.
Terminal Value (TV)= FCF2032 × (1 + g) ÷ (r – g) = CN¥6.6b× (1 + 2.1%) ÷ (8.9%– 2.1%) = CN¥100b
Present Value of Terminal Value (PVTV)= TV / (1 + r)10= CN¥100b÷ ( 1 + 8.9%)10= CN¥43b
The total value, or equity value, is then the sum of the present value of the future cash flows, which in this case is CN¥71b. To get the intrinsic value per share, we divide this by the total number of shares outstanding. Compared to the current share price of US$5.8, the company appears quite undervalued at a 39% discount to where the stock price trades currently. Valuations are imprecise instruments though, rather like a telescope - move a few degrees and end up in a different galaxy. Do keep this in mind.
The Assumptions
Now the most important inputs to a discounted cash flow are the discount rate, and of course, the actual cash flows. If you don't agree with these result, have a go at the calculation yourself and play with the assumptions. The DCF also does not consider the possible cyclicality of an industry, or a company's future capital requirements, so it does not give a full picture of a company's potential performance. Given that we are looking at Full Truck Alliance as potential shareholders, the cost of equity is used as the discount rate, rather than the cost of capital (or weighted average cost of capital, WACC) which accounts for debt. In this calculation we've used 8.9%, which is based on a levered beta of 0.942. Beta is a measure of a stock's volatility, compared to the market as a whole. We get our beta from the industry average beta of globally comparable companies, with an imposed limit between 0.8 and 2.0, which is a reasonable range for a stable business.
SWOT Analysis for Full Truck Alliance
- Currently debt free.
- No major weaknesses identified for YMM.
- Annual earnings are forecast to grow faster than the American market.
- Trading below our estimate of fair value by more than 20%.
- Revenue is forecast to grow slower than 20% per year.
Next Steps:
Valuation is only one side of the coin in terms of building your investment thesis, and it is only one of many factors that you need to assess for a company. DCF models are not the be-all and end-all of investment valuation. Rather it should be seen as a guide to "what assumptions need to be true for this stock to be under/overvalued?" For instance, if the terminal value growth rate is adjusted slightly, it can dramatically alter the overall result. What is the reason for the share price sitting below the intrinsic value? For Full Truck Alliance, we've compiled three pertinent items you should further research:
- Financial Health: Does YMM have a healthy balance sheet? Take a look at our free balance sheet analysis with six simple checks on key factors like leverage and risk.
- Future Earnings: How does YMM's growth rate compare to its peers and the wider market? Dig deeper into the analyst consensus number for the upcoming years by interacting with our free analyst growth expectation chart.
- Other Solid Businesses: Low debt, high returns on equity and good past performance are fundamental to a strong business. Why not explore our interactive list of stocks with solid business fundamentals to see if there are other companies you may not have considered!
PS. The Simply Wall St app conducts a discounted cash flow valuation for every stock on the NYSE every day. If you want to find the calculation for other stocks just search here.
New: AI Stock Screener & Alerts
Our new AI Stock Screener scans the market every day to uncover opportunities.
• Dividend Powerhouses (3%+ Yield)
• Undervalued Small Caps with Insider Buying
• High growth Tech and AI Companies
Or build your own from over 50 metrics.
Have feedback on this article? Concerned about the content? Get in touch with us directly. Alternatively, email editorial-team (at) simplywallst.com.
This article by Simply Wall St is general in nature. We provide commentary based on historical data and analyst forecasts only using an unbiased methodology and our articles are not intended to be financial advice. It does not constitute a recommendation to buy or sell any stock, and does not take account of your objectives, or your financial situation. We aim to bring you long-term focused analysis driven by fundamental data. Note that our analysis may not factor in the latest price-sensitive company announcements or qualitative material. Simply Wall St has no position in any stocks mentioned.
About NYSE:YMM
Full Truck Alliance
Operates a digital freight platform that connects shippers with truckers to facilitate shipments across distance ranges, cargo weights, and types in the People’s Republic of China.
Flawless balance sheet and good value.

