Advertisement
- United States
- /
- Transportation
- /
- NYSE:UNP
How Union Pacific’s Merger Momentum Shapes Its Valuation in 2025

Simply Wall St
Reviewed by Bailey Pemberton
If you have been watching Union Pacific lately, you are not alone. With all eyes glued to the railroad giant’s next moves, many investors are asking themselves, Should I hold, buy, or pass? Union Pacific’s stock has nudged up about 1.1% just in the last week, and with a 5.6% gain over the past month, it has certainly started turning heads again. But here is where things get really interesting: despite softness in the one-year return at -0.2%, the long-term picture remains robust, with a 27% lift over three years and nearly 29% over the past five years.
The recent surge in headlines may be helping fuel this momentum. Government and regulatory drama around Union Pacific’s proposed mega-merger with Norfolk Southern has added both excitement and risk to the story. As presidential support and regulatory shakeups continue to unfold, investors are recalibrating their views on what the company might be worth in this new landscape. The interplay of possible industry consolidation and customer pushback all play into how the market is weighing future risks and opportunities here.
If you are looking for a quick shorthand, Union Pacific clocks in at a valuation score of just 2 out of 6. This means it only screens as undervalued on two key checks. That is not dazzling, but it is not disastrous either. In the next section, we will break down exactly which valuation methods are being used and why the numbers might not tell the whole story. By the end we will take valuation one step further and look at a smarter way to size up this railroad heavyweight.
Union Pacific scores just 2/6 on our valuation checks. See what other red flags we found in the full valuation breakdown.
Approach 1: Union Pacific Discounted Cash Flow (DCF) Analysis
The Discounted Cash Flow (DCF) model estimates a company's intrinsic value by projecting its future cash flows and then discounting them back to today's value. This approach helps investors understand what Union Pacific might truly be worth based on its underlying financial momentum rather than just the share price.
For Union Pacific, the current Free Cash Flow (FCF) is reported at $6.24 Billion. Analysts estimate that FCF will continue to grow, with projections supplied for the next five years and longer-term forecasts extrapolated beyond that. Notably, by 2029, future FCF is expected to reach $9.55 Billion. These cash flow projections provide the backbone of the DCF valuation, helping to build a forward-looking assessment of value.
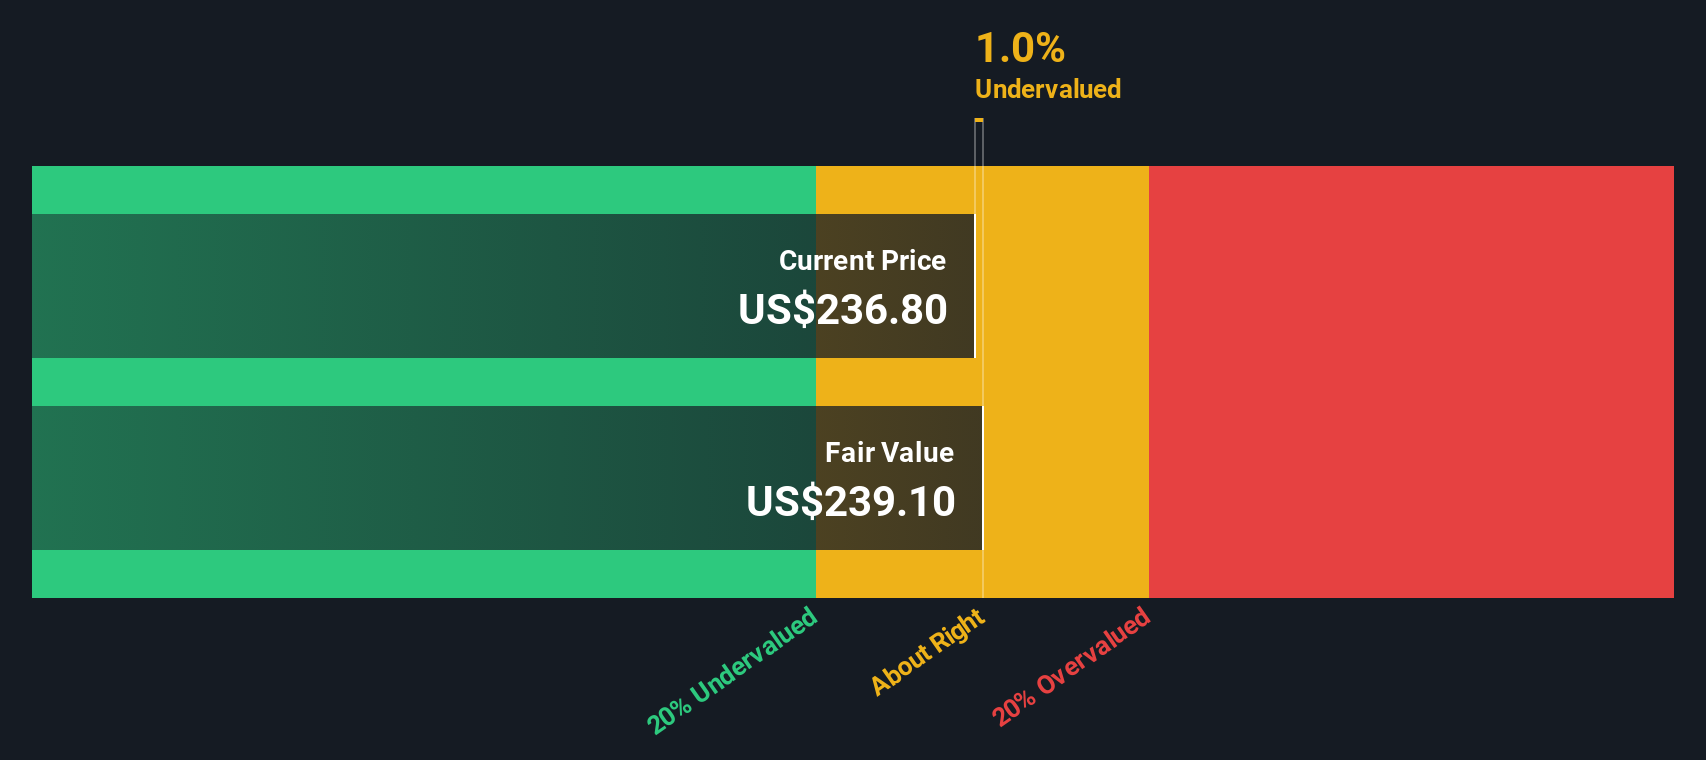
After running these projections through the 2 Stage Free Cash Flow to Equity model, the resulting intrinsic value for Union Pacific comes out to $238.72 per share. This represents a modest discount of approximately 1.8% to the current share price, which suggests the stock is valued about right given its present circumstances.
Result: ABOUT RIGHT
Simply Wall St performs a valuation analysis on every stock in the world every day (check out Union Pacific's valuation analysis). We show the entire calculation in full. You can track the result in your watchlist or portfolio and be alerted when this changes.
Approach 2: Union Pacific Price vs Earnings
Price-to-earnings (PE) ratio is a widely used valuation tool for profitable companies like Union Pacific because it ties the company’s market price directly to its core profitability. This ratio helps investors see how much they are paying for each dollar of earnings, making it especially useful for mature, consistently profitable businesses within the transportation sector.
It is important to remember that what counts as a “normal” or “fair” PE can vary greatly depending on expectations for future growth and perceived risks in the business. Higher growth prospects or lower perceived risks can justify a higher PE. Conversely, slower growth or higher risks would pull it lower.
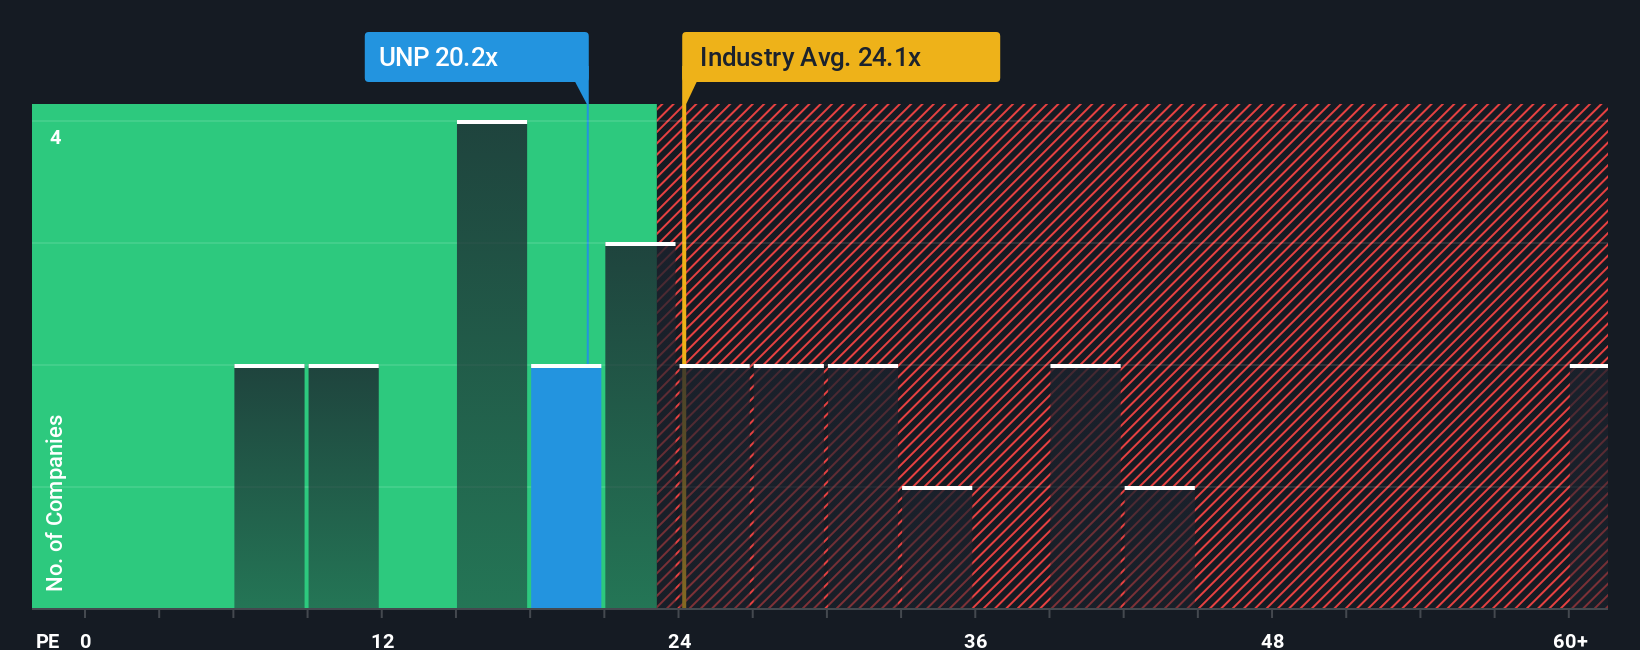
Union Pacific currently trades at a PE of 20.05x. For context, the average PE ratio of its major peers comes in at 17.50x, and the broader transportation industry exhibits a higher average at 23.86x. This puts Union Pacific in the middle of the pack, suggesting neither a steep discount nor a hefty premium based solely on these comparisons.
However, Simply Wall St’s “Fair Ratio” model takes things a step further. This metric estimates what PE ratio is truly appropriate by weighing not only earnings growth and risks but also how Union Pacific measures up on factors like profit margins, company size, and its broader industry landscape. As a result, the Fair Ratio serves as a more sophisticated benchmark than the generic peer or industry averages and produces a fairer, company-specific assessment.
Union Pacific’s Fair Ratio is calculated at 19.27x, landing almost exactly on its current PE of 20.05x. The slight difference between these is negligible, suggesting that the stock’s valuation is fundamentally justified by its earnings, growth outlook, and risk profile.
Result: ABOUT RIGHT
PE ratios tell one story, but what if the real opportunity lies elsewhere? Discover companies where insiders are betting big on explosive growth.
Upgrade Your Decision Making: Choose your Union Pacific Narrative
Earlier we mentioned that there is an even better way to understand valuation, so let us introduce you to Narratives. A Narrative is your personal story about where you think a company, like Union Pacific, is headed and why. It connects your view on its future financials, such as revenue, earnings, and margins, with your estimate of fair value. Narratives empower you to turn numbers into a clear investing perspective, linking together the company’s story, a financial forecast, and a resulting valuation all in one place. They are simple, accessible, and available for anyone to use on Simply Wall St’s Community page, which is already trusted by millions of investors.
With Narratives, you can see at a glance how your fair value compares to the current price and decide if you might want to buy, hold, or sell. These updates are dynamic as news or earnings are released. For example, one Union Pacific investor might believe new infrastructure and tech upgrades will drive growth and set a fair value as high as $294.0. Another might be more cautious about trade risks and set their target at $213.0. Narratives put these perspectives side by side, so you can find the one that matches your outlook and make smarter, faster decisions.
Do you think there's more to the story for Union Pacific? Create your own Narrative to let the Community know!

This article by Simply Wall St is general in nature. We provide commentary based on historical data and analyst forecasts only using an unbiased methodology and our articles are not intended to be financial advice. It does not constitute a recommendation to buy or sell any stock, and does not take account of your objectives, or your financial situation. We aim to bring you long-term focused analysis driven by fundamental data. Note that our analysis may not factor in the latest price-sensitive company announcements or qualitative material. Simply Wall St has no position in any stocks mentioned.
New: AI Stock Screener & Alerts
Our new AI Stock Screener scans the market every day to uncover opportunities.
• Dividend Powerhouses (3%+ Yield)
• Undervalued Small Caps with Insider Buying
• High growth Tech and AI Companies
Or build your own from over 50 metrics.
Have feedback on this article? Concerned about the content? Get in touch with us directly. Alternatively, email editorial-team@simplywallst.com
About NYSE:UNP
Union Pacific
Through its subsidiary, Union Pacific Railroad Company, operates in the railroad business in the United States.
Solid track record established dividend payer.
Similar Companies
Market Insights

Advertisement
Community Narratives
The Next Phase of Energy Storage: How NeoVolta Is Tackling America’s Power Crunch
Fair Value US$7.50|35.2% undervalued
MA
Community Contributor
Why EnSilica is Worth Possibly 13x its Current Price
Fair Value UK£5.00|89.8% undervalued
DO
Community Contributor
M&A Activity, Industry Diversification & A Defense Contract Monopoly Will Push BWXT For Healthy Long-Term Growth
Fair Value US$220.00|15.6% undervalued
CL
Community Contributor
A case for Cassiar Gold Corp (TSXV: GLDC) to reach CAD$8-10 before 2030 (X30-37)
Fair Value CA$10.00|97.1% undervalued
AG
Community Contributor