Advertisement
- United States
- /
- Marine and Shipping
- /
- NYSE:DAC
Does Danaos Still Offer Value After Its Recent 11% Drop?

Simply Wall St
Reviewed by Bailey Pemberton
If you’re thinking about what to do with Danaos stock right now, you’re not alone. It’s a name that’s been steadily catching the eye of both value investors and shipping sector watchers. Just last year, Danaos logged an impressive 6.0% gain, and if you zoom out to the last three years, you’ll see a robust 61.5% return. What really jumps off the page is the stunning 919.6% rise over five years, rewarding early believers in a big way. Even though the stock has cooled a bit lately, down 3.8% over the past week and 11.2% for the month, many attribute these short-term moves to broader market jitters around global trade rather than anything fundamentally broken with the company.
So where does Danaos stand right now? Based on our scoring approach, where 1 point is given for each area a company appears undervalued, Danaos clocks in with a value score of 3 out of 6. That’s a solid outcome, but it also hints at some nuance hiding behind the numbers. Is the market underestimating Danaos’s outlook, or are there risks the price is now factoring in? Let’s dig into the different valuation tools investors use to size up Danaos. Before we finish, we’ll talk about a method that might give you an even sharper read on what the numbers really mean.
Approach 1: Danaos Discounted Cash Flow (DCF) Analysis
The Discounted Cash Flow (DCF) model estimates a company’s intrinsic value by projecting its future cash flows and discounting them back to the present. This approach gives investors a sense of what the business is really worth, based on potential future earnings rather than just current profits or assets.
For Danaos, the latest reported Free Cash Flow stands at $218.3 million. Analyst forecasts provide estimates up to 2027, projecting a notable decrease to $14 million by the end of that year. Beyond five years, Simply Wall St extends these estimates with their own extrapolations, showing that projected free cash flows continue to shrink through 2035. This paints a picture of moderating, rather than accelerating, cash generation in the coming decade.
By aggregating and discounting these annual cash flow projections, the DCF model arrives at an intrinsic value of $14.34 per share for Danaos. When compared to the current share price, this implies the stock is trading 486.1% above its estimated fair value. In simple terms, the DCF analysis suggests Danaos is significantly overvalued by the market at this time.
Result: OVERVALUED
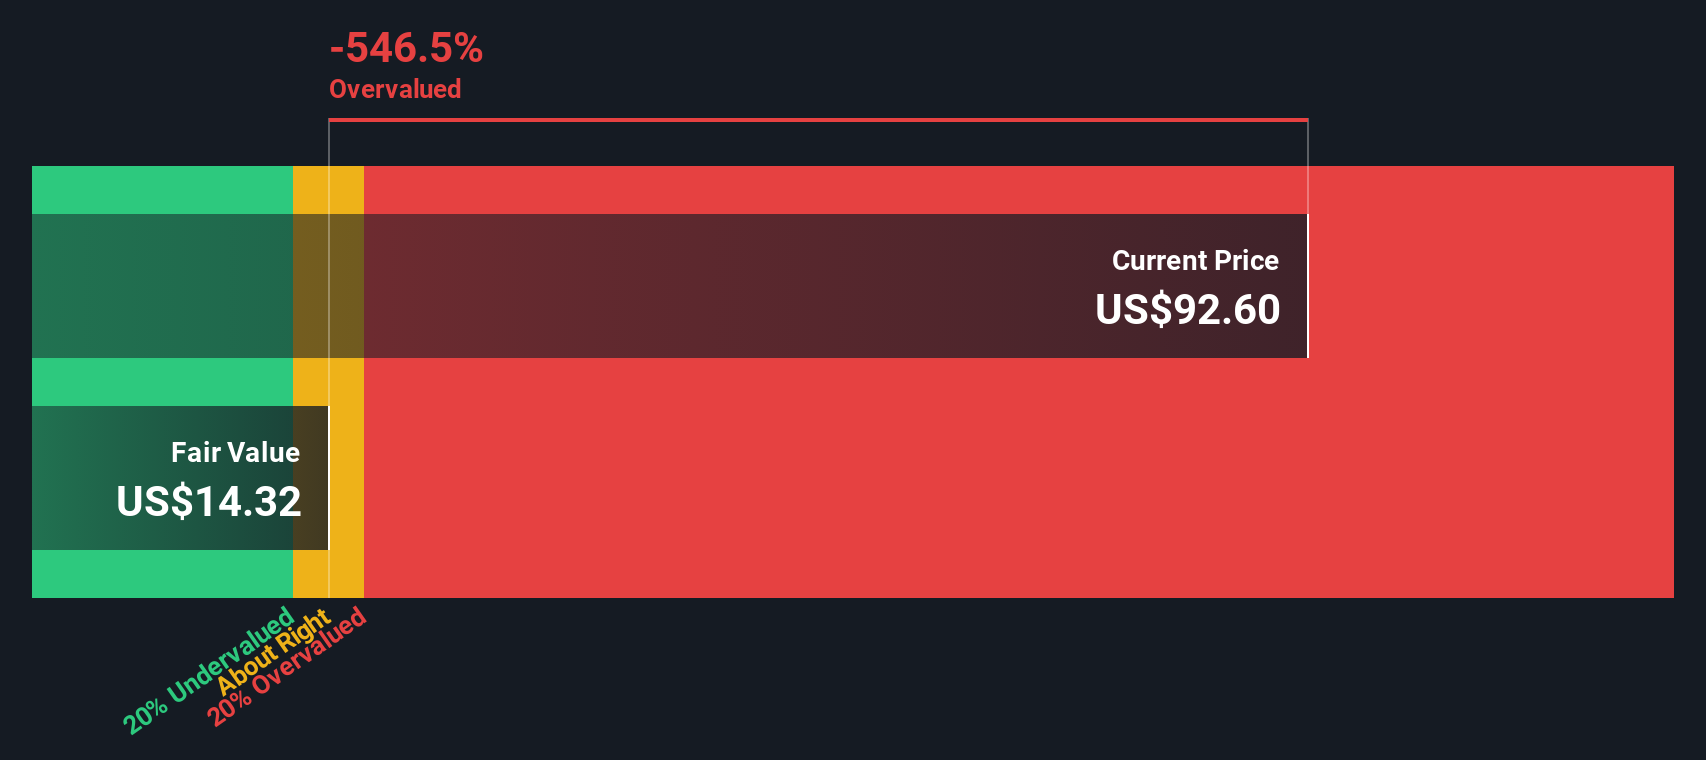
Our Discounted Cash Flow (DCF) analysis suggests Danaos may be overvalued by 486.1%. Find undervalued stocks or create your own screener to find better value opportunities.
Approach 2: Danaos Price vs Earnings
For profitable companies like Danaos, the Price-to-Earnings (PE) ratio is a widely used and effective valuation tool. It measures how much investors are willing to pay for each dollar of current earnings, making it especially relevant when the company's profits are reliable and visible. Typically, a lower PE can signal undervaluation, while a higher one might indicate expectations of future growth or lower perceived risk.
The right PE ratio for any stock is not a fixed figure, as it depends on both anticipated growth and the risks specific to the company. Higher expected growth or lower risk justifies a higher "normal" PE, while the opposite would push it lower. Danaos currently trades at a PE of 3.35x, which stands out compared to the shipping industry average of 7.29x and a peer average of 5.21x.
Simply Wall St’s "Fair Ratio" takes the analysis a step further. Instead of just comparing against industry or peers, it calculates the PE a company should trade at by considering its earnings growth, profit margin, risk profile, market cap, and industry characteristics. For Danaos, the Fair Ratio is 6.94x, reflecting these nuanced factors and providing a more tailored gauge of value than raw benchmarks.
Looking at Danaos’s current PE of 3.35x versus the Fair Ratio of 6.94x, the stock appears noticeably undervalued based on this metric.
Result: UNDERVALUED

PE ratios tell one story, but what if the real opportunity lies elsewhere? Discover companies where insiders are betting big on explosive growth.
Upgrade Your Decision Making: Choose your Danaos Narrative
Earlier we mentioned there’s a sharper way to understand valuation, so let’s introduce you to Narratives, a tool where you build a story for Danaos by combining your view of its future with the underlying numbers. Narratives connect your perspective on Danaos’s business, such as expected changes in shipping demand, decarbonization risks, or contract security, to key forecasts like revenue, profit margins, and fair value. This approach bridges the gap between headlines and hard data.
On Simply Wall St’s Community page, used by millions of investors, Narratives make it simple to express and compare your assumptions about Danaos. They link your views to a dynamic fair value that updates whenever new information, such as earnings or news, arrives. With Narratives, you can instantly see whether Danaos’s current market price aligns with your outlook, making decisions to buy or sell more targeted and informed.
For example, one investor’s Narrative might be that earnings will fall and Danaos should trade at a PE of 4.0x, setting their fair value at around $64. Another investor might believe in stable profits and assign a PE of 6.9x, putting fair value near $101. This shows how each story leads to its own actionable conclusion.
Do you think there's more to the story for Danaos? Create your own Narrative to let the Community know!

This article by Simply Wall St is general in nature. We provide commentary based on historical data and analyst forecasts only using an unbiased methodology and our articles are not intended to be financial advice. It does not constitute a recommendation to buy or sell any stock, and does not take account of your objectives, or your financial situation. We aim to bring you long-term focused analysis driven by fundamental data. Note that our analysis may not factor in the latest price-sensitive company announcements or qualitative material. Simply Wall St has no position in any stocks mentioned.
New: Manage All Your Stock Portfolios in One Place
We've created the ultimate portfolio companion for stock investors, and it's free.
• Connect an unlimited number of Portfolios and see your total in one currency
• Be alerted to new Warning Signs or Risks via email or mobile
• Track the Fair Value of your stocks
Have feedback on this article? Concerned about the content? Get in touch with us directly. Alternatively, email editorial-team@simplywallst.com
About NYSE:DAC
Danaos
Through its subsidiaries, owns and operates containerships and drybulk vessels in Australia, Europe, and the United States.
Flawless balance sheet and fair value.
Similar Companies
Market Insights

Advertisement
Community Narratives
MicroVision will explode future revenue by 380.37% with a vision towards success
Fair Value US$60|98.4% undervalued
TH
Community Contributor
The Indispensable Artery for a New North American Economy
Fair Value CA$132.87|0.7% overvalued
TI
Community Contributor
Recently Updated Narratives
CE

cementafriend on Constellation Energy ·
Constellation Energy Dividends and Growth
Fair Value:US$348.054.7% overvalued
2 followersusers have followed this narrative
0 commentsusers have commented on this narrative
0 likesusers have liked this narrative
KH

Khagani on CoreWeave ·
CoreWeave's Revenue Expected to Rocket 77.88% in 5-Year Forecast
Fair Value:US$11033.5% undervalued
4 followersusers have followed this narrative
0 commentsusers have commented on this narrative
0 likesusers have liked this narrative
PO

PortfolioPlus on Bisalloy Steel Group ·
Bisalloy Steel Group will shine with a projected profit margin increase of 12.8%
Fair Value:AU$6.7117.6% undervalued
3 followersusers have followed this narrative
0 commentsusers have commented on this narrative
0 likesusers have liked this narrative
Popular Narratives
TH

TheWallstreetKing on MicroVision ·
MicroVision will explode future revenue by 380.37% with a vision towards success
Fair Value:US$6098.4% undervalued
108 followersusers have followed this narrative
10 commentsusers have commented on this narrative
21 likesusers have liked this narrative
AN


AnalystConsensusTarget on NVIDIA ·
NVDA: Expanding AI Demand Will Drive Major Data Center Investments Through 2026
Fair Value:US$250.3929.3% undervalued
936 followersusers have followed this narrative
6 commentsusers have commented on this narrative
24 likesusers have liked this narrative
OS


oscargarcia on Alphabet ·
The company that turned a verb into a global necessity and basically runs the modern internet, digital ads, smartphones, maps, and AI.
Fair Value:US$3405.8% undervalued
144 followersusers have followed this narrative
6 commentsusers have commented on this narrative
18 likesusers have liked this narrative