Advertisement
- United States
- /
- Telecom Services and Carriers
- /
- NasdaqGS:CMCSA
Is Comcast (CMCSA) Pricing Create An Opportunity After Recent Share Price Weakness

Reviewed by Bailey Pemberton
- If you are trying to figure out whether Comcast's current share price reflects good value or not, it helps to separate short term noise from what the numbers actually say.
- The stock recently closed at US$29.76, with returns of 4.8% over the last week, 5.8% over the last month, 0.7% year to date, and a 2.5% decline over the last year, along with 3 year and 5 year declines of 9.5% and 30.3% respectively.
- Recent coverage around Comcast has largely centered on its position as a major US telecom and media provider, including ongoing attention on its broadband, cable, and content operations. This context helps explain why investors may be reassessing both its short term risks and its longer term potential.
- Simply Wall St currently gives Comcast a valuation score of 5 out of 6. Next, we break down what that means across different valuation approaches, and then conclude with a way to look at valuation that goes beyond the usual metrics.
Find out why Comcast's -2.5% return over the last year is lagging behind its peers.
Approach 1: Comcast Discounted Cash Flow (DCF) Analysis
A Discounted Cash Flow, or DCF, model estimates what a company might be worth today by projecting its future cash flows and then discounting those back into a single present value.
For Comcast, Simply Wall St uses a 2 Stage Free Cash Flow to Equity model built on its recent free cash flow of about $18.4b. Analysts supply cash flow estimates for the coming years, and beyond that the platform extrapolates further projections. By 2030, the model uses a projected free cash flow of $15.7b, with a full path of annual projections that are discounted back to today using the selected cost of equity assumptions.
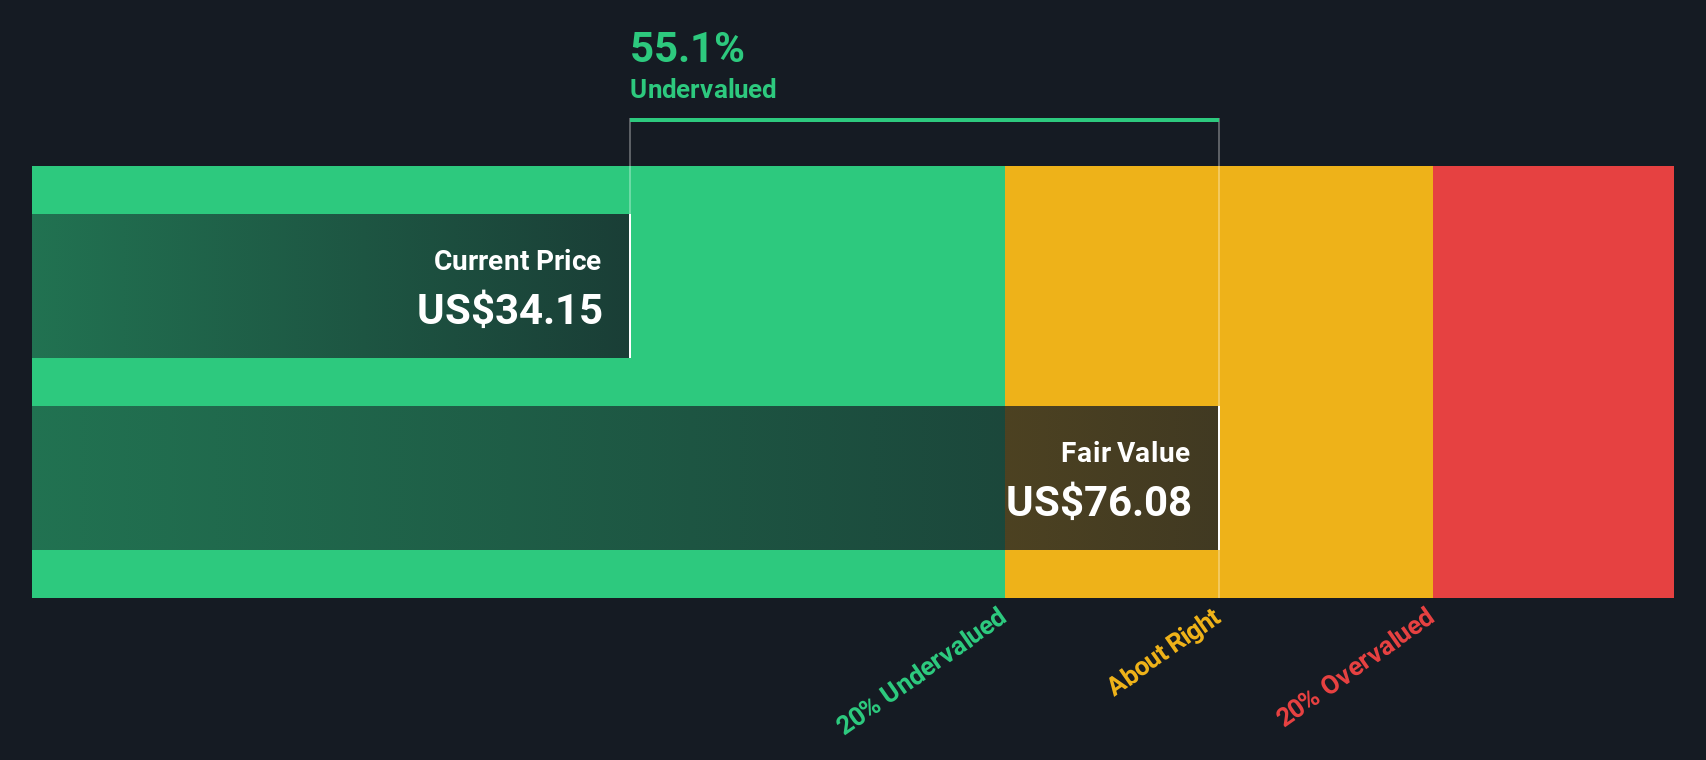
Putting all of those projected cash flows together, the DCF model arrives at an estimated intrinsic value of about $74.04 per share. When compared with the recent share price of $29.76, this implies a 59.8% discount, which suggests the shares are currently assessed as undervalued on this model alone.
Result: UNDERVALUED
Our Discounted Cash Flow (DCF) analysis suggests Comcast is undervalued by 59.8%. Track this in your watchlist or portfolio, or discover 867 more undervalued stocks based on cash flows.
Approach 2: Comcast Price vs Earnings (P/E)
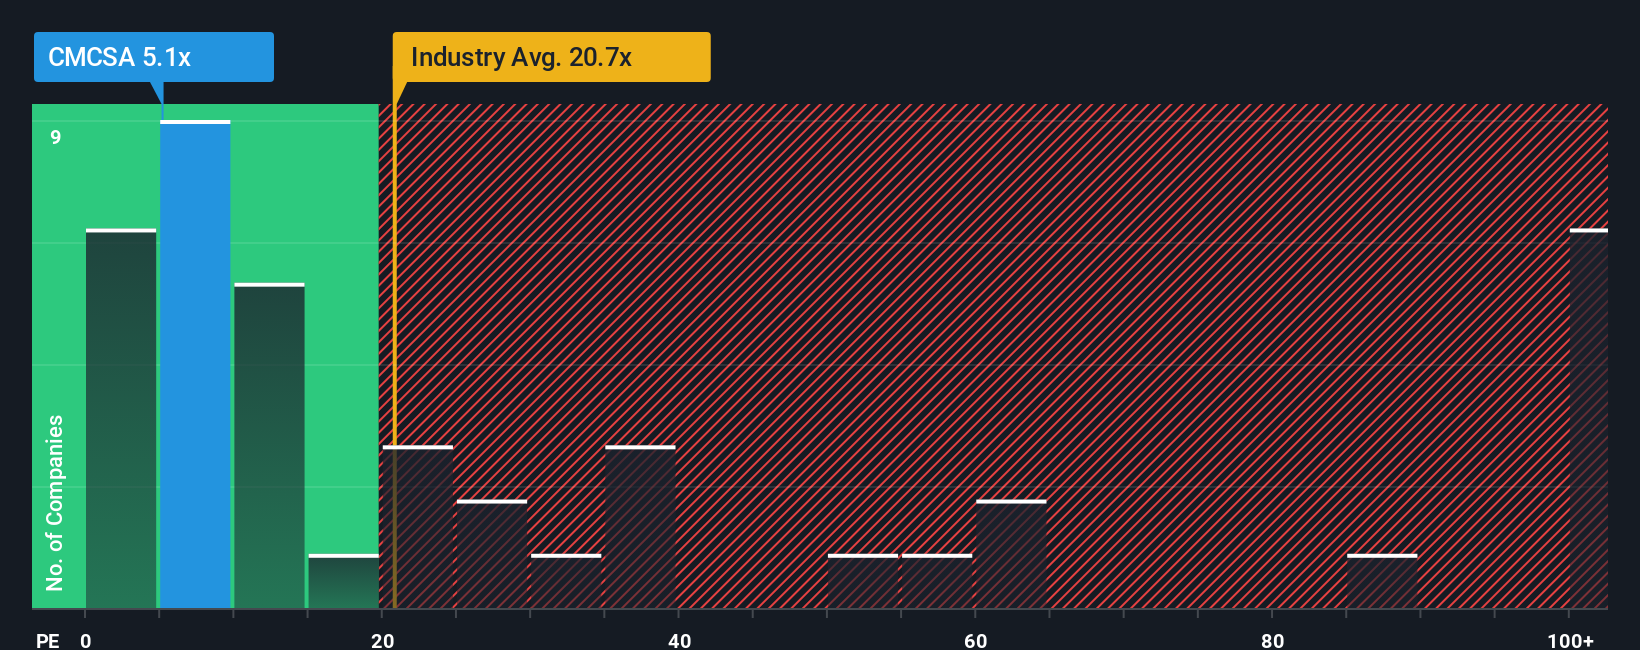
For a profitable company like Comcast, the P/E ratio is a useful way to relate what you pay per share to the earnings that each share generates. Investors usually expect higher P/E ratios when they see stronger earnings growth or lower perceived risk, and lower P/E ratios when growth expectations or predictability look weaker.
Comcast currently trades on a P/E of 5.42x. That sits below the Telecom industry average P/E of 16.45x and also below the peer group average of 6.86x. Simply Wall St then goes a step further with its proprietary “Fair Ratio”, which estimates what Comcast’s P/E might be given factors such as its earnings growth profile, industry, profit margins, market cap and specific risks.
This Fair Ratio for Comcast is 10.05x, which is higher than the current P/E of 5.42x. Because the Fair Ratio incorporates company specific factors rather than just broad peer or industry comparisons, it aims to give a more tailored view of what could be a reasonable multiple for Comcast. On this metric, the shares screen as trading below that Fair Ratio.
Result: UNDERVALUED
P/E ratios tell one story, but what if the real opportunity lies elsewhere? Discover 1422 companies where insiders are betting big on explosive growth.
Upgrade Your Decision Making: Choose your Comcast Narrative
Earlier we mentioned that there is an even better way to understand valuation, so let us introduce you to Narratives, a simple way to attach your own story about Comcast to the numbers you see, including your assumed fair value and your expectations for future revenue, earnings and margins.
A Narrative links three things together: the story you believe about the business, the financial forecast that story implies, and the fair value that falls out of those assumptions.
On Simply Wall St, millions of investors can create and explore Narratives on the Community page, where each Narrative becomes an easy to read toolkit that compares a user’s Fair Value estimate with the current share price to help them decide whether they see Comcast as closer to a buy, hold or sell for their own portfolio.
Because Narratives on the platform are refreshed when new information such as news or earnings is added, your view of Comcast can adjust over time. You can see, for example, one investor using very optimistic revenue and margin assumptions that justify a much higher fair value per share, while another uses more cautious estimates that support a much lower fair value, even though both are looking at the same stock price.
Do you think there's more to the story for Comcast? Head over to our Community to see what others are saying!

This article by Simply Wall St is general in nature. We provide commentary based on historical data and analyst forecasts only using an unbiased methodology and our articles are not intended to be financial advice. It does not constitute a recommendation to buy or sell any stock, and does not take account of your objectives, or your financial situation. We aim to bring you long-term focused analysis driven by fundamental data. Note that our analysis may not factor in the latest price-sensitive company announcements or qualitative material. Simply Wall St has no position in any stocks mentioned.
New: AI Stock Screener & Alerts
Our new AI Stock Screener scans the market every day to uncover opportunities.
• Dividend Powerhouses (3%+ Yield)
• Undervalued Small Caps with Insider Buying
• High growth Tech and AI Companies
Or build your own from over 50 metrics.
Have feedback on this article? Concerned about the content? Get in touch with us directly. Alternatively, email editorial-team@simplywallst.com
About NasdaqGS:CMCSA
Comcast
Operates as a media and technology company worldwide.
6 star dividend payer and undervalued.
Similar Companies
Market Insights


Advertisement
Weekly Picks
ST


stuart_roberts on Upside Gold ·
An Undervalued 3.3Moz Gold Project in Canada
Fair Value:CA$5.0776.1% undervalued
209 followersusers have followed this narrative
1 commentusers have commented on this narrative
30 likesusers have liked this narrative
SI


SimpleMan887 on GameStop ·
GameStop will ace the financial crisis wave with its strategic Bitcoin investment and cash reserves
Fair Value:US$22089.6% undervalued
53 followersusers have followed this narrative
2 commentsusers have commented on this narrative
21 likesusers have liked this narrative
YI

yiannisz on Hesai Group ·
The First Real Lidar Winner
Fair Value:US$27.0719.6% undervalued
13 followersusers have followed this narrative
1 commentusers have commented on this narrative
4 likesusers have liked this narrative
TR


tripledub on Taiwan Semiconductor Manufacturing ·
The Most Wonderful Monopoly in the Most Dangerous Neighbourhood on Earth
Fair Value:US$3814.1% undervalued
10 followersusers have followed this narrative
0 commentsusers have commented on this narrative
11 likesusers have liked this narrative
Recently Updated Narratives
AS


AstrisCorporateAdvisory on Ceres ·
Proven business incubator in transition
Fair Value:JP¥2.37k36.4% undervalued
1 followerusers have followed this narrative
0 commentsusers have commented on this narrative
0 likesusers have liked this narrative
FA

FA_Trader on Hektar Real Estate Investment Trust ·
Hektar REIT: Outlook is getting more interesting as retail stabilises and diversification starts to kick in
Fair Value:RM 0.4910.2% undervalued
2 followersusers have followed this narrative
0 commentsusers have commented on this narrative
0 likesusers have liked this narrative
AG


Agricola on Guanajuato Silver ·
A Case for Guanajuato Silver (TSXV:GSVR) to reach (low end) CAD$4 (high end) CAD$18 by 2031
Fair Value:CA$1896.4% undervalued
19 followersusers have followed this narrative
4 commentsusers have commented on this narrative
0 likesusers have liked this narrative
Popular Narratives
TR

tripledub on Microsoft ·
Everyone's Terrified Microsoft Will Keep Spending. I'm Terrified They'll Stop.
Fair Value:US$3955.6% undervalued
43 followersusers have followed this narrative
3 commentsusers have commented on this narrative
41 likesusers have liked this narrative
RO


Robbo on Tesla ·
The academically fascinating Tesla
Fair Value:US$301.1k% overvalued
36 followersusers have followed this narrative
11 commentsusers have commented on this narrative
31 likesusers have liked this narrative
AN

AnalystConsensusTarget on Microsoft ·
Analyst Commentary Highlights Microsoft AI Momentum and Upward Valuation Amid Growth and Competitive Risks
Fair Value:US$587.3136.5% undervalued
1346 followersusers have followed this narrative
2 commentsusers have commented on this narrative
11 likesusers have liked this narrative