Is Fabrinet (NYSE:FN) Worth US$216 Based On Its Intrinsic Value?


Key Insights
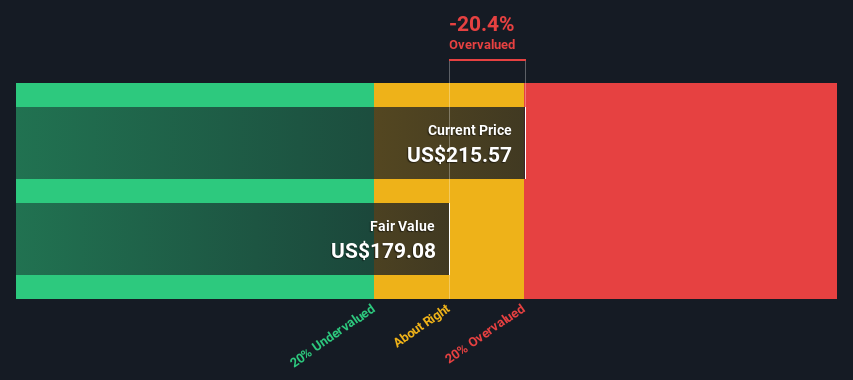
- The projected fair value for Fabrinet is US$179 based on 2 Stage Free Cash Flow to Equity
- Fabrinet is estimated to be 20% overvalued based on current share price of US$216
- Analyst price target for FN is US$208, which is 16% above our fair value estimate
Does the March share price for Fabrinet (NYSE:FN) reflect what it's really worth? Today, we will estimate the stock's intrinsic value by taking the expected future cash flows and discounting them to today's value. We will take advantage of the Discounted Cash Flow (DCF) model for this purpose. It may sound complicated, but actually it is quite simple!
We would caution that there are many ways of valuing a company and, like the DCF, each technique has advantages and disadvantages in certain scenarios. For those who are keen learners of equity analysis, the Simply Wall St analysis model here may be something of interest to you.
View our latest analysis for Fabrinet
Is Fabrinet Fairly Valued?
We are going to use a two-stage DCF model, which, as the name states, takes into account two stages of growth. The first stage is generally a higher growth period which levels off heading towards the terminal value, captured in the second 'steady growth' period. In the first stage we need to estimate the cash flows to the business over the next ten years. Where possible we use analyst estimates, but when these aren't available we extrapolate the previous free cash flow (FCF) from the last estimate or reported value. We assume companies with shrinking free cash flow will slow their rate of shrinkage, and that companies with growing free cash flow will see their growth rate slow, over this period. We do this to reflect that growth tends to slow more in the early years than it does in later years.
A DCF is all about the idea that a dollar in the future is less valuable than a dollar today, and so the sum of these future cash flows is then discounted to today's value:
10-year free cash flow (FCF) estimate
| 2024 | 2025 | 2026 | 2027 | 2028 | 2029 | 2030 | 2031 | 2032 | 2033 | |
| Levered FCF ($, Millions) | US$310.3m | US$276.8m | US$325.0m | US$340.0m | US$353.3m | US$365.4m | US$376.7m | US$387.4m | US$397.8m | US$408.0m |
| Growth Rate Estimate Source | Analyst x3 | Analyst x4 | Analyst x3 | Est @ 4.61% | Est @ 3.91% | Est @ 3.43% | Est @ 3.09% | Est @ 2.85% | Est @ 2.68% | Est @ 2.56% |
| Present Value ($, Millions) Discounted @ 7.3% | US$289 | US$240 | US$263 | US$256 | US$248 | US$239 | US$230 | US$220 | US$211 | US$201 |
("Est" = FCF growth rate estimated by Simply Wall St)
Present Value of 10-year Cash Flow (PVCF) = US$2.4b
The second stage is also known as Terminal Value, this is the business's cash flow after the first stage. For a number of reasons a very conservative growth rate is used that cannot exceed that of a country's GDP growth. In this case we have used the 5-year average of the 10-year government bond yield (2.3%) to estimate future growth. In the same way as with the 10-year 'growth' period, we discount future cash flows to today's value, using a cost of equity of 7.3%.
Terminal Value (TV)= FCF2033 × (1 + g) ÷ (r – g) = US$408m× (1 + 2.3%) ÷ (7.3%– 2.3%) = US$8.3b
Present Value of Terminal Value (PVTV)= TV / (1 + r)10= US$8.3b÷ ( 1 + 7.3%)10= US$4.1b
The total value, or equity value, is then the sum of the present value of the future cash flows, which in this case is US$6.5b. To get the intrinsic value per share, we divide this by the total number of shares outstanding. Compared to the current share price of US$216, the company appears slightly overvalued at the time of writing. The assumptions in any calculation have a big impact on the valuation, so it is better to view this as a rough estimate, not precise down to the last cent.
Important Assumptions
The calculation above is very dependent on two assumptions. The first is the discount rate and the other is the cash flows. Part of investing is coming up with your own evaluation of a company's future performance, so try the calculation yourself and check your own assumptions. The DCF also does not consider the possible cyclicality of an industry, or a company's future capital requirements, so it does not give a full picture of a company's potential performance. Given that we are looking at Fabrinet as potential shareholders, the cost of equity is used as the discount rate, rather than the cost of capital (or weighted average cost of capital, WACC) which accounts for debt. In this calculation we've used 7.3%, which is based on a levered beta of 1.092. Beta is a measure of a stock's volatility, compared to the market as a whole. We get our beta from the industry average beta of globally comparable companies, with an imposed limit between 0.8 and 2.0, which is a reasonable range for a stable business.
SWOT Analysis for Fabrinet
- Earnings growth over the past year exceeded the industry.
- Debt is not viewed as a risk.
- Earnings growth over the past year is below its 5-year average.
- Expensive based on P/E ratio and estimated fair value.
- Annual earnings are forecast to grow faster than the American market.
- Revenue is forecast to grow slower than 20% per year.
Looking Ahead:
Whilst important, the DCF calculation shouldn't be the only metric you look at when researching a company. It's not possible to obtain a foolproof valuation with a DCF model. Instead the best use for a DCF model is to test certain assumptions and theories to see if they would lead to the company being undervalued or overvalued. For example, changes in the company's cost of equity or the risk free rate can significantly impact the valuation. What is the reason for the share price exceeding the intrinsic value? For Fabrinet, we've compiled three additional elements you should further examine:
- Risks: Case in point, we've spotted 1 warning sign for Fabrinet you should be aware of.
- Management:Have insiders been ramping up their shares to take advantage of the market's sentiment for FN's future outlook? Check out our management and board analysis with insights on CEO compensation and governance factors.
- Other Solid Businesses: Low debt, high returns on equity and good past performance are fundamental to a strong business. Why not explore our interactive list of stocks with solid business fundamentals to see if there are other companies you may not have considered!
PS. Simply Wall St updates its DCF calculation for every American stock every day, so if you want to find the intrinsic value of any other stock just search here.
New: AI Stock Screener & Alerts
Our new AI Stock Screener scans the market every day to uncover opportunities.
• Dividend Powerhouses (3%+ Yield)
• Undervalued Small Caps with Insider Buying
• High growth Tech and AI Companies
Or build your own from over 50 metrics.
Have feedback on this article? Concerned about the content? Get in touch with us directly. Alternatively, email editorial-team (at) simplywallst.com.
This article by Simply Wall St is general in nature. We provide commentary based on historical data and analyst forecasts only using an unbiased methodology and our articles are not intended to be financial advice. It does not constitute a recommendation to buy or sell any stock, and does not take account of your objectives, or your financial situation. We aim to bring you long-term focused analysis driven by fundamental data. Note that our analysis may not factor in the latest price-sensitive company announcements or qualitative material. Simply Wall St has no position in any stocks mentioned.
About NYSE:FN
Fabrinet
Provides optical packaging and precision optical, electro-mechanical, and electronic manufacturing services in North America, the Asia-Pacific, and Europe.
Flawless balance sheet with solid track record.
Similar Companies
Market Insights

Community Narratives
