
Advertisement
- United States
- /
- Communications
- /
- NasdaqGS:VSAT
Health Check: How Prudently Does Viasat (NASDAQ:VSAT) Use Debt?
Legendary fund manager Li Lu (who Charlie Munger backed) once said, 'The biggest investment risk is not the volatility of prices, but whether you will suffer a permanent loss of capital.' It's only natural to consider a company's balance sheet when you examine how risky it is, since debt is often involved when a business collapses. Importantly, Viasat, Inc. (NASDAQ:VSAT) does carry debt. But the real question is whether this debt is making the company risky.
When Is Debt Dangerous?
Debt assists a business until the business has trouble paying it off, either with new capital or with free cash flow. Ultimately, if the company can't fulfill its legal obligations to repay debt, shareholders could walk away with nothing. However, a more frequent (but still costly) occurrence is where a company must issue shares at bargain-basement prices, permanently diluting shareholders, just to shore up its balance sheet. Having said that, the most common situation is where a company manages its debt reasonably well - and to its own advantage. The first step when considering a company's debt levels is to consider its cash and debt together.
View our latest analysis for Viasat
What Is Viasat's Debt?
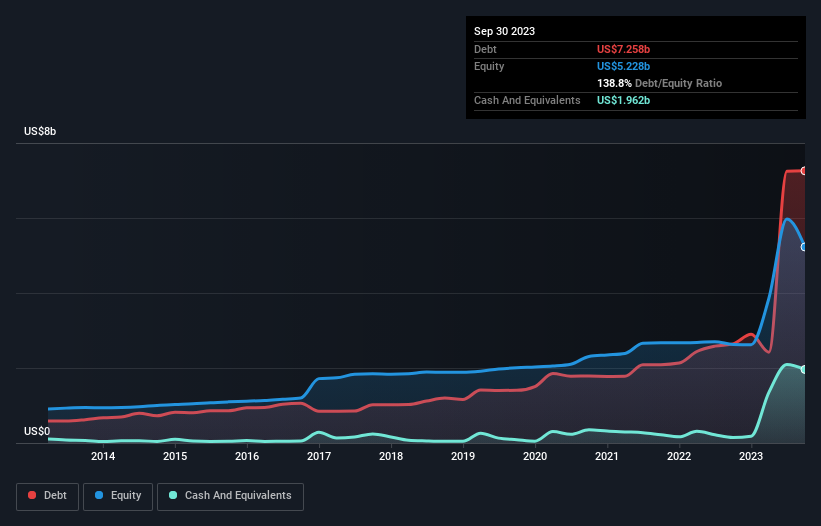
The image below, which you can click on for greater detail, shows that at September 2023 Viasat had debt of US$7.26b, up from US$2.64b in one year. On the flip side, it has US$1.96b in cash leading to net debt of about US$5.30b.
A Look At Viasat's Liabilities
The latest balance sheet data shows that Viasat had liabilities of US$1.55b due within a year, and liabilities of US$10.3b falling due after that. Offsetting these obligations, it had cash of US$1.96b as well as receivables valued at US$1.43b due within 12 months. So its liabilities total US$8.45b more than the combination of its cash and short-term receivables.
This deficit casts a shadow over the US$3.05b company, like a colossus towering over mere mortals. So we definitely think shareholders need to watch this one closely. After all, Viasat would likely require a major re-capitalisation if it had to pay its creditors today. There's no doubt that we learn most about debt from the balance sheet. But ultimately the future profitability of the business will decide if Viasat can strengthen its balance sheet over time. So if you're focused on the future you can check out this free report showing analyst profit forecasts.
Over 12 months, Viasat reported revenue of US$3.3b, which is a gain of 34%, although it did not report any earnings before interest and tax. With any luck the company will be able to grow its way to profitability.
Caveat Emptor
Despite the top line growth, Viasat still had an earnings before interest and tax (EBIT) loss over the last year. Indeed, it lost a very considerable US$943m at the EBIT level. If you consider the significant liabilities mentioned above, we are extremely wary of this investment. Of course, it may be able to improve its situation with a bit of luck and good execution. But we think that is unlikely, given it is low on liquid assets, and burned through US$888m in the last year. So we think this stock is risky, like walking through a dirty dog park with a mask on. The balance sheet is clearly the area to focus on when you are analysing debt. However, not all investment risk resides within the balance sheet - far from it. These risks can be hard to spot. Every company has them, and we've spotted 2 warning signs for Viasat (of which 1 makes us a bit uncomfortable!) you should know about.
When all is said and done, sometimes its easier to focus on companies that don't even need debt. Readers can access a list of growth stocks with zero net debt 100% free, right now.
New: Manage All Your Stock Portfolios in One Place
We've created the ultimate portfolio companion for stock investors, and it's free.
• Connect an unlimited number of Portfolios and see your total in one currency
• Be alerted to new Warning Signs or Risks via email or mobile
• Track the Fair Value of your stocks
Have feedback on this article? Concerned about the content? Get in touch with us directly. Alternatively, email editorial-team (at) simplywallst.com.
This article by Simply Wall St is general in nature. We provide commentary based on historical data and analyst forecasts only using an unbiased methodology and our articles are not intended to be financial advice. It does not constitute a recommendation to buy or sell any stock, and does not take account of your objectives, or your financial situation. We aim to bring you long-term focused analysis driven by fundamental data. Note that our analysis may not factor in the latest price-sensitive company announcements or qualitative material. Simply Wall St has no position in any stocks mentioned.
About NasdaqGS:VSAT
Viasat
Provides broadband and communications products and services in the United States and internationally.
Undervalued with mediocre balance sheet.
Similar Companies
Market Insights

Advertisement
Community Narratives
A formidable player in AI and enterprise computing.
Fair Value US$210.00|2.3% overvalued
CO
Community Contributor
IREN's Bold Moves in Sustainable Bitcoin Mining & AI Data Centers
Fair Value US$72.52|17.6% undervalued
BL
Community Contributor
Cooling the Champions: The Aussie Tech Behind F1's Victories
Fair Value AU$12.40|40.4% undervalued
TR
Community Contributor